Fig. 5.
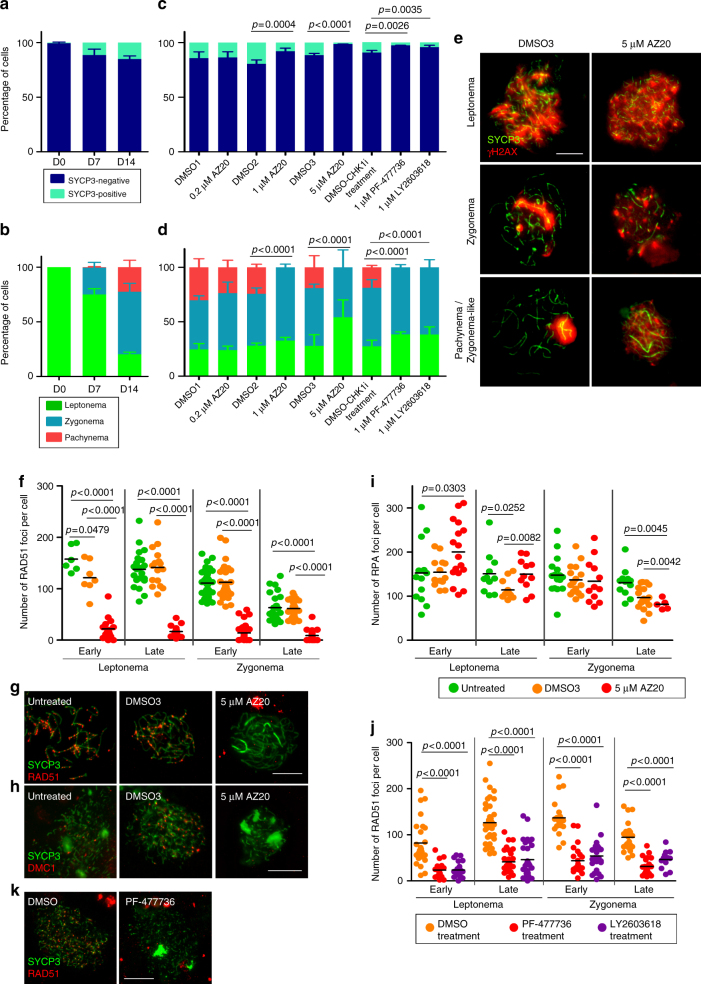
In vitro inhibition of ATR and CHK1 block recombination and prophase progression. a Percentage of SYCP3-positive cells in untreated testis fragments at 0, 7, and 14 days of culture. Columns and lines indicate the mean and SD from four replicates. b Mean percentage of spermatocytes at the indicated stages of prophase in untreated testis fragments from two replicates. c Proportion of SYCP3-positive cells at D14 in testis fragments treated with the indicated dosages of AZ20, PF-477736, or LY2603618, and their respective DMSO controls. Data obtained from three replicates per each condition. P values are from Fisher’s exact tests. d Proportion of spermatocytes at different stages of meiotic prophase at D14 of culture. Data obtained from two replicates per each condition. P values are from G tests. e Representative images of spermatocytes from testes treated with DMSO3 or 5 μM AZ20 showing progression of meiotic prophase, followed by staining for SYCP3 and γH2AX. f RAD51 foci at the indicated stages from D14 cultures (Color code key is in panel i). In this and other graphs of focus counts, horizontal lines denote the means and p values are from pairwise t tests. g, h Representative spermatocytes from cultured samples stained for SYCP3 and either RAD51 (g) or DMC1 (h). i RPA foci in cultured spermatocytes. j RAD51 foci per spermatocyte from control and PF-477736- or LY2603618-treated samples. k Representative images of spermatocytes from D14 cultures treated with DMSO or 1 µM PF-477736 and immunostained for SYCP3 and RAD51. Data presented for each culture condition correspond to at least two experiments performed using different samples. Scale bars in all micrographs represent 10 μm

