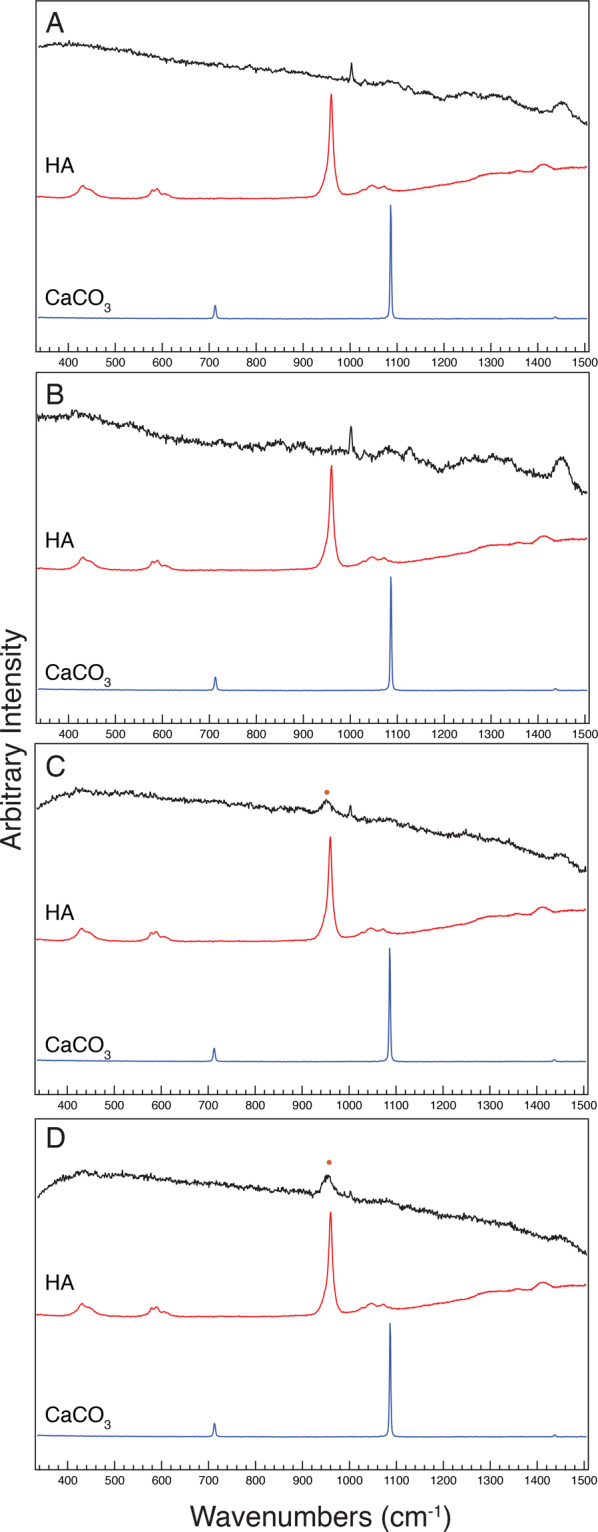
Figure 3.

Raman spectra taken from the center of the surface of colonies of (A) P. putida KT2440, (B) P. syringae pv. morsprunorum 5795, (C) P. syringae pv. tomato DC3000, and (D) P. fluorescens Pf0-1, at six days of growth are colored black in each panel. A control for hydroxyapatite is labelled “HA” and is colored red and a control for calcium carbonate is labelled “CaCO3” and is colored blue. A broad peak slightly downshifted from 960 cm−1 is labelled with an orange dot and signifies the presence of amorphous calcium phosphate on the surface of cells. Bands commonly associated with biological organisms, including a peak for DNA (782 cm−1) and phenylalanine (1004 cm−1) and broad bands associated with amides (1230–1300 cm−1) and methyl groups (1430–1460 cm−1) can be seen on these spectra as well. This assay was performed three separate times and the spectra are representative of the assays. The y-axis is in arbitrary intensity units and the x-axis is in wavenumbers (cm−1).
