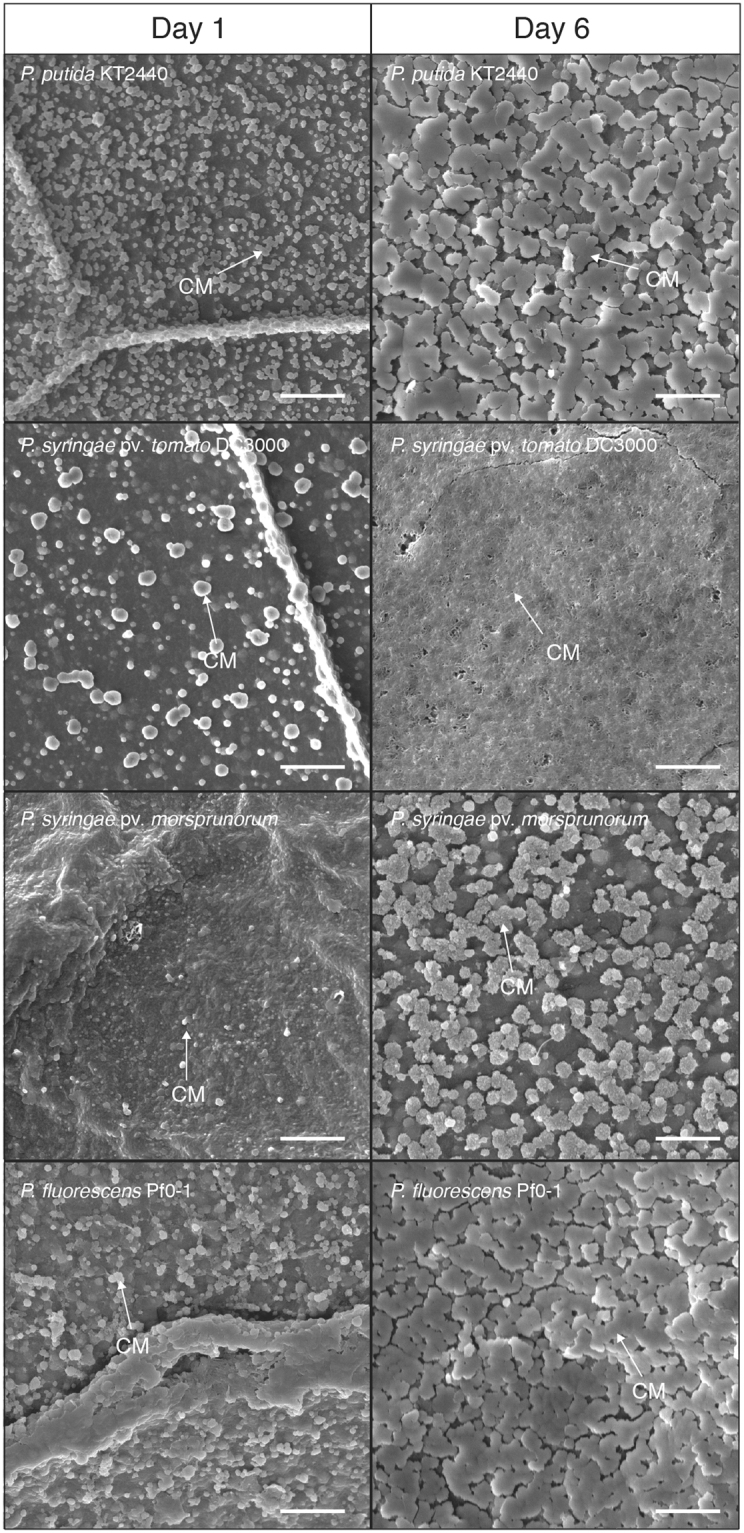
Figure 6.

SEM images at 18,000x magnification of the agar adjacent to bacterial colonies for P. putida KT2440, P. syringae pv. morsprunorum 5795, P. syringae pv. tomato DC3000, and P. fluorescens Pf0-1 after 12 hours and six days of growth. 2 µm scale bars are indicated in the lower right-hand corner of the images. Arrows labelled “CM” points to calcium phosphate that has formed on the agar. Imaging of the agar adjacent to colonies was performed three times using three separate biological replicates. This image is representative of what was observed with the other replicates.
