Figure 7.

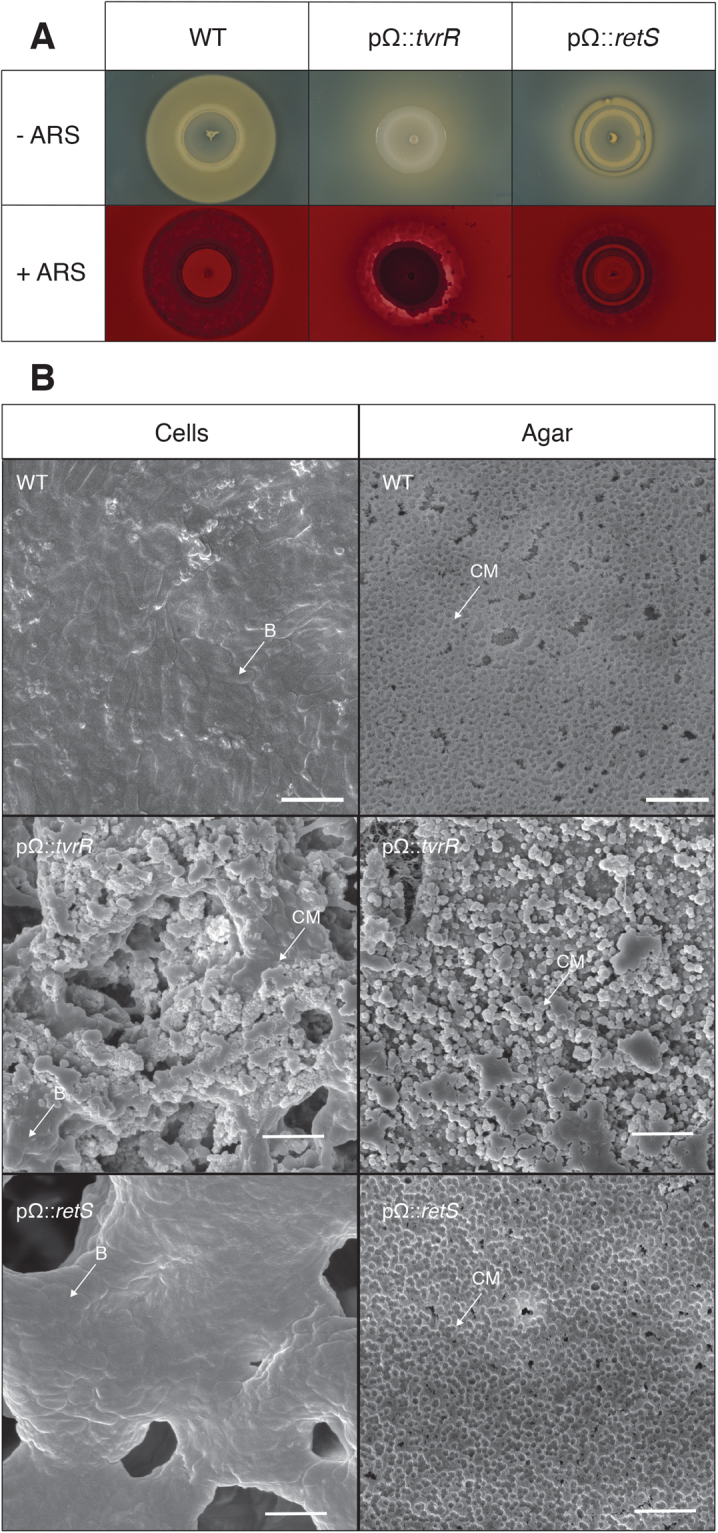
(A) Pictures of P. syringae pv. tomato DC3000, P. syringae pv. tomato DC3000 pΩ::tvrR, and P. syringae pv. tomato DC3000 pΩ::retS grown on NB agar supplemented with calcium after four days of growth on plates. Pictures were taken of the same colony before and after staining of the colonies with 1.0% (w/v) ARS. These pictures are representative of the phenotype observed in each strain after four days of growth on NB agar supplemented with calcium. This assay was repeated with three independent biological replicates and these pictures are representative of what was observed each time. (B) SEM images at 18,000x magnification of colony surface for P. syringae pv. tomato DC3000, agar adjacent to P. syringae pv. tomato DC3000, colony surface for P. syringae pv. tomato DC3000 pΩ::tvrR, agar adjacent to P. syringae pv. tomato DC3000 pΩ::tvrR, colony surface for P. syringae pv. tomato DC3000 pΩ::retS, and agar adjacent to P. syringae pv. tomato DC3000 pΩ::retS after six days of growth on NB supplemented with Ca2+. 2 µm scale bars are indicated in the lower right-hand corner of the images. An arrow pointing to calcium phosphate (CM) and an arrow pointing at bacteria (B) are included in the images when calcium phosphate or bacteria were present. Bacterial cells and agar were imaged with three independent biological replicates. The images used are representative of what was observed each time.
