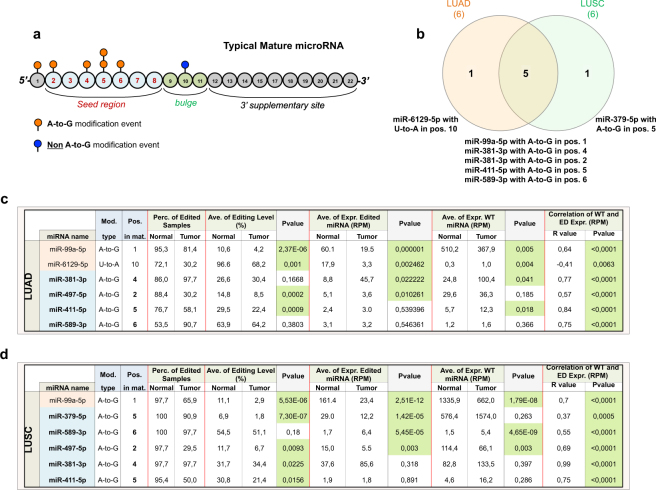
Figure 1.
RNA editing hotspots in LUAD and LUSC tissue samples. (a) Diagram showing the distribution of all detected editing hotspots across miRNA nucleotide positions. (b) Venn diagram of RNA editing hotspots in LUAD and LUSC samples, showing that the majority of editing hotspots is shared. (c,d) Statistics for miRNA editing hotsposts and WT counterparts in normal and tumor samples for both LUAD and LUSC. Hotsposts occurring within MSRs are in light blue, while those outside the MSR are in light orange. P-values were calculated with the following methods respectively: Mann-Withney paired test for editing level; paired t-test for ED\WT miRNA expression; Pearson correlation test between WT\ED miRNA expressions. Significant P-values (P < 0.05) are in green.

