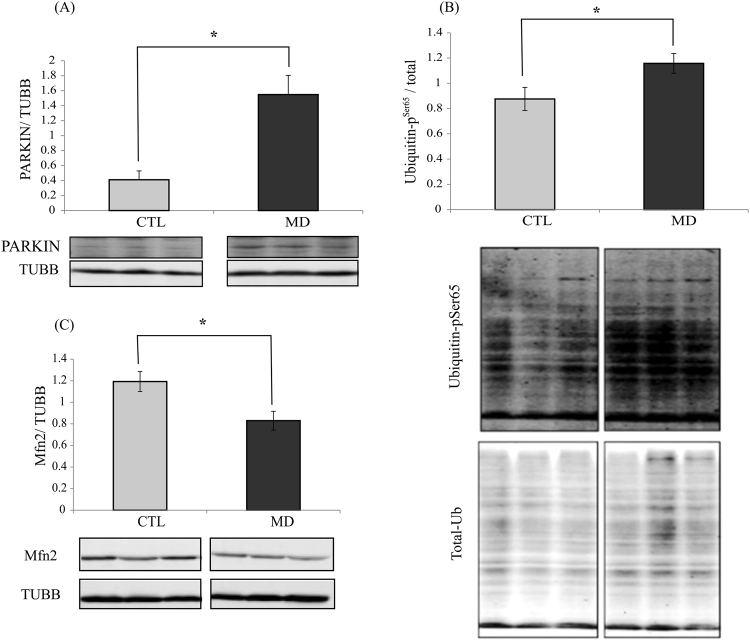
Figure 7.
Methionine deficiency leads to induction of the PINK11/PARKIN axis. Western blot analysis of (A) PARKIN, (B) Ubiquitin-pSer65 and (C) Mfn2 in the liver of trout fed the control diet (CTL) or methionine-deficient diet (MD) and sampled 16 h after feeding the last meal. Western blot analysis was carried out on six individual samples per treatment, and a representative blot is shown (Source data for each blot are available in Supplementary Figs 6 and 7). Graphs show the ratio of the targeted protein: β-tubulin (TUBB) or the total amount of the targeted protein used as a loading control. Values are means (n = 6), with standard error of the mean represented by vertical bars. *was used to indicate significant difference between treatment among the two dietary group (P < 0.05; t-test).

