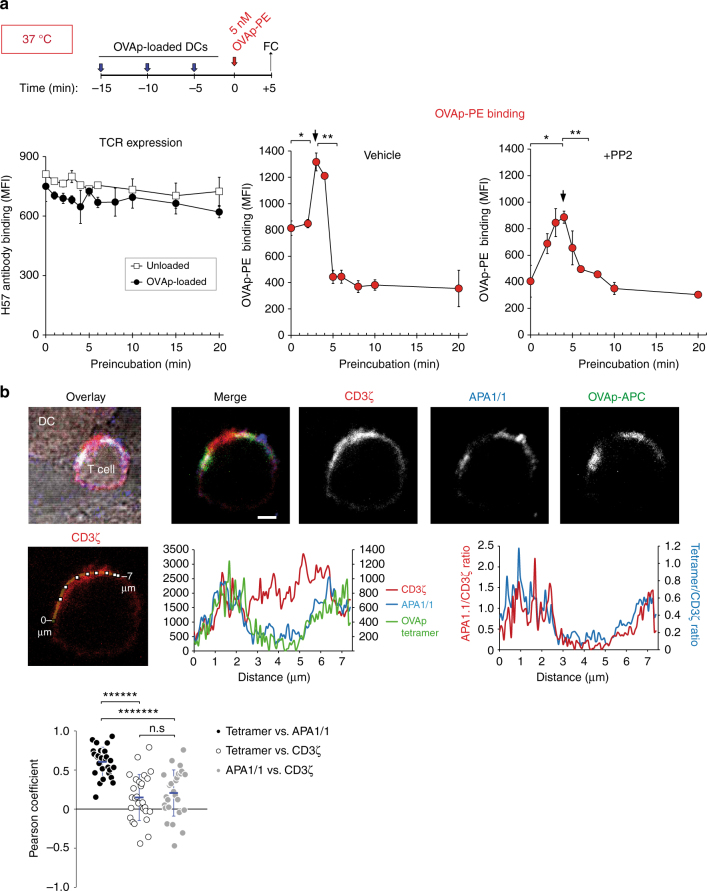
Fig. 7.
The sites of enhanced tetramer binding co-localise with the Active TCR at the periphery of the immunological synapse. a CD8 + OT-1 T cells were treated with 20 µM PP2 or vehicle for 30 min at 37 °C and then preincubated for the indicates times at 37 °C in the presence of mouse bone-marrow-derived dendritic cells (mDCs) loaded with OVA peptide. Subsequently, cells were incubated with 5 nM OVAp-PE for 5 min. Afterwards, cells were fixed and stained with anti-CD8 and anti-H57 antibodies to quantify TCR expression. b CD8 + T cells from OT-1 CD3ζ-GFP mice were purified by negative selection and incubated for 8 min at 37 °C in the presence of mDCs attached to a coverslip and pre-loaded with OVA peptide. Subsequently, cells were incubated with 20 nM OVAp-APC for 5 min. Before visualisation by confocal microscopy, cells were fixed, permeabilized and stained with APA1-1 (top panel). Scale bar represents 1 μm. Line scan drawn along the synaptic zone to show relative fluorescence intensity of CD3ζ, APA1-1 and OVAp-tetramer (middle left panel). Relative fluorescence intensities of CD3ζ, APA1-1 and OVAp-tetramer are represented versus distance (middle centre). Ratios between the relative fluorescence intensity of APA1-1 and CD3ζ or OVAp-tetramer and CD3ζ are represented versus distance (middle right). Pearson correlation coefficients between the tetramer and APA1-1, the tetramer and CD3ζ, or APA1-1 and CD3ζ intensity distributions (bottom panel) are for n = 27 immunological synapses

