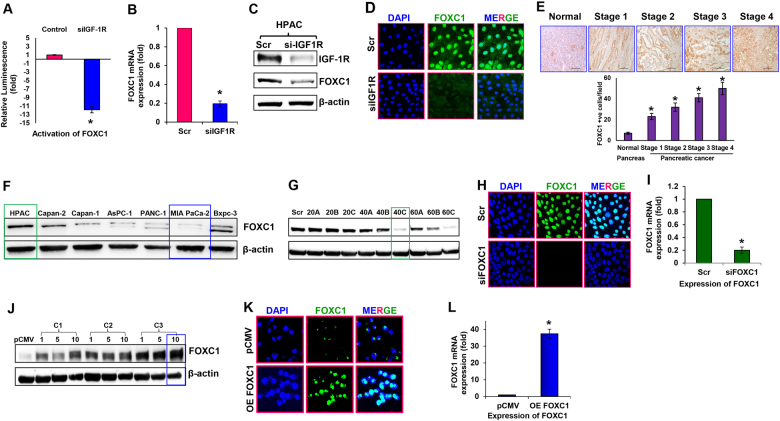
Fig. 1. Silencing and overexpression of FOXC1 in pancreatic cancer cells.
a Activity of FOXC1 transcription factor in IGF-1R-silenced HPAC cells. b Relative mRNA expression level of FOXC1 was assessed by real-time RT-PCR in IGF-1R-silenced HPAC cells. c Western blot analysis of IGF-1R and FOXC1 expression in IGF-1R-silenced HPAC cells. d Representative photographs of immunofluorescence analysis of FOXC1 expression in IGF-1R-silenced HPAC cells were visualized via confocal microscopy at × 60 magnification. e Representative qualitative (FOXC1-positive cells indicated by brown staining) and quantitative immunohistochemical analysis (bar diagram represents # of FOXC1-positive cells/field) of FOXC1 by tumor stage in human pancreatic ductal adenocarcinoma tissues and in normal pancreas tissue at × 40 magnification. IHC staining was quantitated at five random fields per section with at least 200 cells/field. f Western blot analysis of FOXC1 expression in a panel pancreatic cancer cell lines (HPAC, Capan-2, Capan-1, AsPC-1, PANC-1, MIA PaCa-2, and BxPC-3). g HPAC cells were transfected with three predesigned FOXC1 siRNAs (labeled as A, B, and C) at concentrations of 20, 40, and 60 nM along with scrambled control siRNA (Scr). Silencing efficacy of FOXC1 siRNA was determined using western blot analysis. h Representative photographs of immunofluorescence analysis of FOXC1 expression in FOXC1-silenced HPAC cells at × 60 magnification. i Relative mRNA expression level of FOXC1 was assessed by real-time PCR in FOXC1-silenced HPAC cells. j MIA PaCa-2 cells were transfected with FOXC1-overexpressing plasmid DNA from three different colonies (labeled as C1, C2, and C3) at concentrations of 1, 5, and 10 µg along with pCMV control plasmid DNA. Overexpression efficacy of FOXC1 plasmid DNA in MIA PaCa-2 cells was determined using western blotting. k Representative photographs of immunofluorescence analysis of FOXC1 expression in FOXC1-overexpressing MIA PaCa-2 cells at × 60 magnification. l Relative mRNA expression level of FOXC1 was assessed by real-time PCR in FOXC1-overexpressing MIA PaCa-2 cells. Data shown as mean ± SEM. Experiments (n = 3) were repeated three times in triplicates. *p < 0.05

