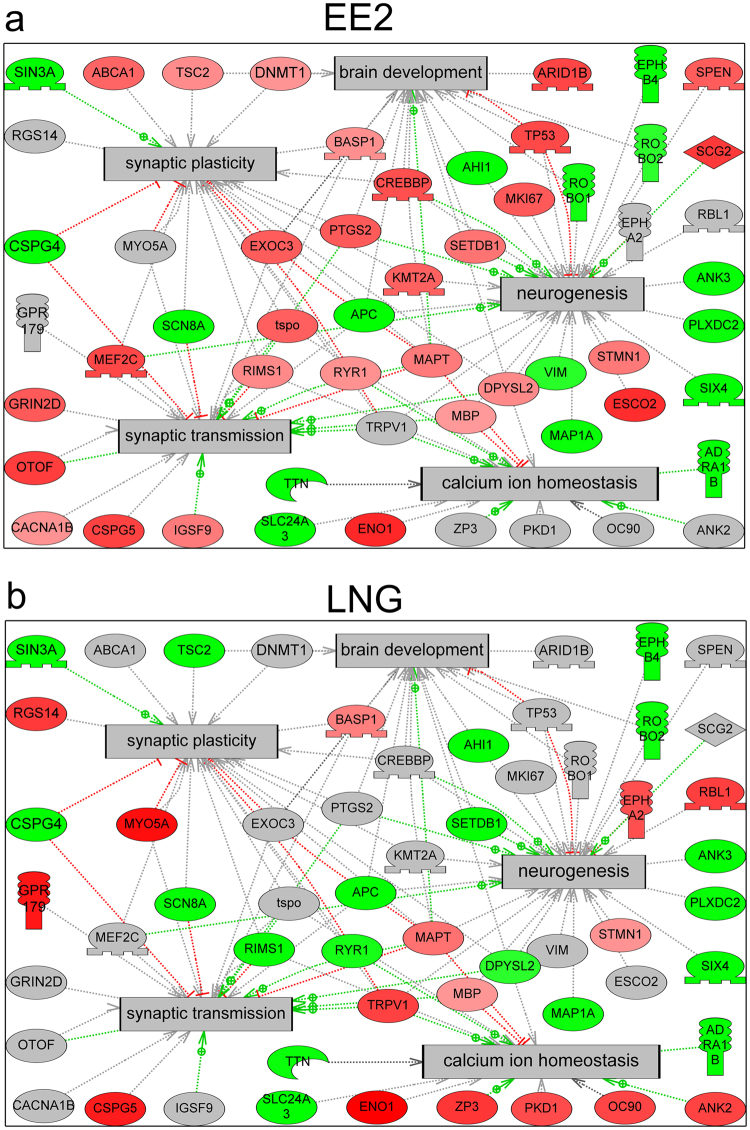
Figure 6.
EE2 and LNG affected the phosphorylation of proteins involved in brain development, synaptic plasticity, neurogenesis, synaptic transmission, and calcium ion homeostasis although the specific phosphorylation profiles varied. Figures depict union pathways of proteins phosphorylated in response to EE2 (a) and LNG (b) and their interactions with significantly enriched (p < 0.05) cell processes (gray boxes) as determined by subnetwork enrichment analysis using Pathway Studio 9 (Ariadne Genomics) operating on the ResNet 10.0 mammalian database. Proteins exhibiting increased phosphorylation are colored red, proteins exhibiting decreased phosphorylation are colored green, and phosphoproteins that were not identified in a specific treatment are colored gray. Red linkages indicate up-regulation, green linkages indicate down-regulation, and gray linkages indicate unknown regulation.

