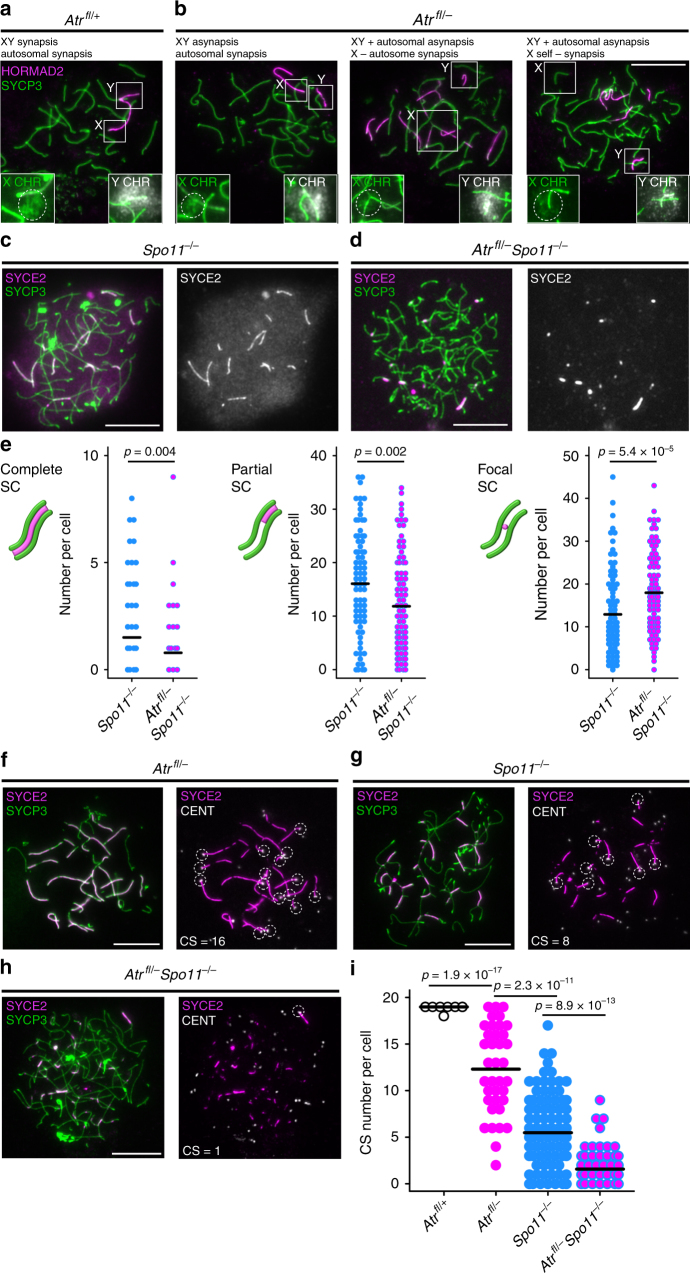
Fig. 3.
ATR is required for homologous synapsis. Examples of early pachytene synaptic outcomes in a Atrfl/+ males (n = 3 males) and b Atrfl/– males (n = 3 males) assessed using HORMAD2 (magenta), SYCP3 (green) and subsequent DNA FISH using Slx and Sly probes (labeled in insets as X chromosome in green and Y chromosome in white). The Slx probe hybridizes to a sub-region of the X chromosome (circled), while the Sly probe coats the majority of the Y chromosome. In Atrfl/+ males (a), both the autosomes and the XY PARs are synapsed, while the non-homologous regions of the XY pair are asynapsed. In Atrfl/+ males (n = 104 cells, 2 males), 90 cells had normal synapsis, 12 cells had asynapsis of both the XY and autosomes, 1 cell had asynapsis only of the XY and 1 cell had asynapsis only of the autosomes. b Three examples of synaptic defects in Atrfl/– males, each described above respective image. In Atrfl/– males (n = 107 cells, 2 males), 21 cells had normal synapsis, 59 cells had asynapsis of both the XY and autosomes, 23 cells had asynapsis only of the XY, 4 cells had asynapsis only of the autosomes, 10 cells had X self-synapsis, 11 cells had Y self-synapsis and 7 had non-homologous synapsis between the X and/or Y and autosomes. c, d Comparison of pachytene synaptic outcomes in c Spo11−/− and d Atrfl/– Spo11−/− males using immunostaining for SYCE2 (magenta) and SYCP3 (green). e Quantitation of complete, partial and focal SC in Spo11−/− males (n = 2 males; 88 cells) and Atrfl/– Spo11−/− males (n = 2 males; 96 cells). Means and p values (unpaired t-test) indicated. f–h Epistasis analysis of SPO11 and ATR in synapsis using the same markers plus immunostaining for centromeres (CENT; white) to determine CS number. For each cell, colocalizing SYCE2-CENT signals are indicated with dashed circles, and resulting CS numbers are shown. i CS number in Atrfl/+ males (n = 2 males; 55 cells), Atrfl/– males (n = 2 males; 37 cells), Spo11−/− males (n = 2 males; 114 cells) and Atrfl/– Spo11−/− males (n = 2 males; 64 cells). Mean values and p values (Mann–Whitney test) indicated. Scale bars 10 µm

