Figure 5.

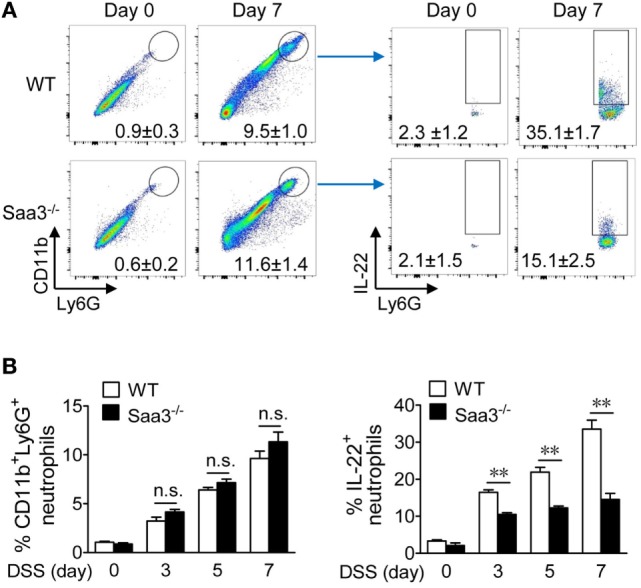
Flow cytometry analysis of colonic neutrophils in wild type (WT) and Saa3−/− mice. Male and female mice 8–10 weeks of age were used in the experiments. (A) Representative flow cytometry dot plots of colonic neutrophils from WT and Saa3−/− mice were determined (left panels). This population of neutrophils was further analyzed by IL-22 staining (right), based on data from five mice in each group treated with dextran sulfate sodium (DSS) for 0, 3, 5, and 7 days. Data collected on day 7 were shown. The quantification results are shown in (B) for the percentage of CD11b+Ly6Ghigh cells (left) and the percentage of IL-22+ neutrophils in that population of neutrophils (right). Shown are mean ± standard margin of error based on three measurements. **p < 0.01 between samples.
