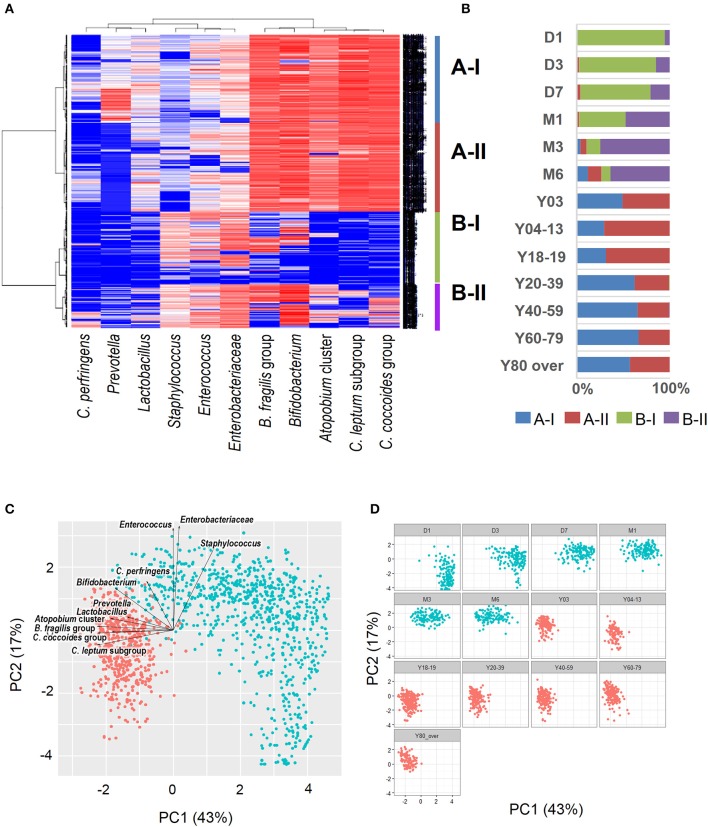
Figure 2.
Heat-map analysis (A), classification by hierarchical clustering (B), and principal component analysis plots (C: all subjects; D: age-wise) of intestinal bacterial microbiota in healthy Japanese volunteers (n = 1951). Red dots indicate infant type of microbiota (day 0 to age 6 months) and blue dots indicate adult type (3 years to over 80 years). Arrows indicate characteristic vectors of the factor loadings of 11 bacterial groups.

