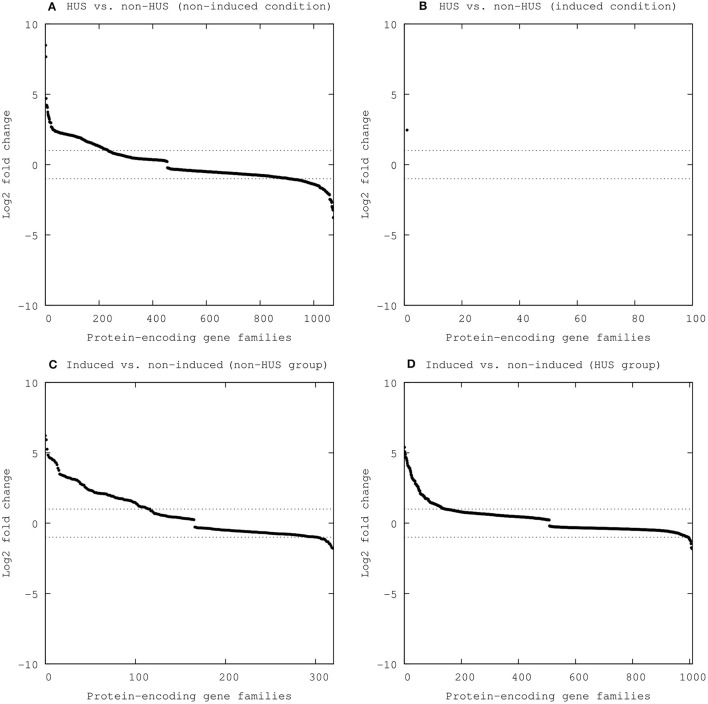
Figure 2.
Differentially expressed protein-encoding gene families between groups (HUS vs. non-HUS) and conditions (induced vs. non-induced). Statistically significant results (FDR < 0.05) are included, with expression shown as log2 fold change (y-axis) for each gene family (x-axis) (A) HUS vs. non-HUS (non-induced conditions), (B) HUS vs. non-HUS (induced conditions), (C) Induced vs. non-induced (non-HUS group), and (D) Induced vs. non-induced (HUS group).

