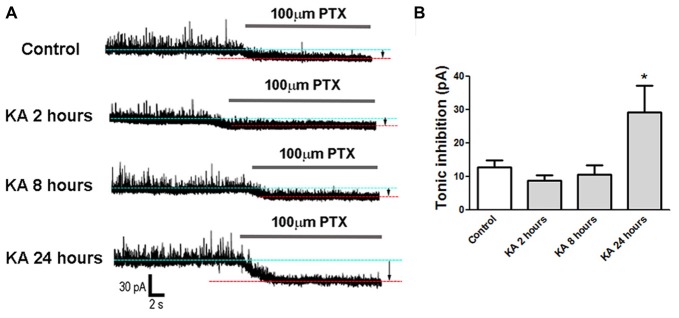
Figure 4.
Tonic inhibition recorded in KA-injected mice. (A) Tonic inhibitory currents were recorded in mice brain slices at 2 h, 8 h and 24 h after KA injection or control. The gap between two baselines in the absence (blue dotted line) or presence (red dotted line) of 100 μM picrotoxin (PTX) represents tonic inhibition (arrows). (B) Tonic inhibition was quantified in control and KA-injected mice (n = 7–11 cells from three mice in each group). *P < 0.05.

