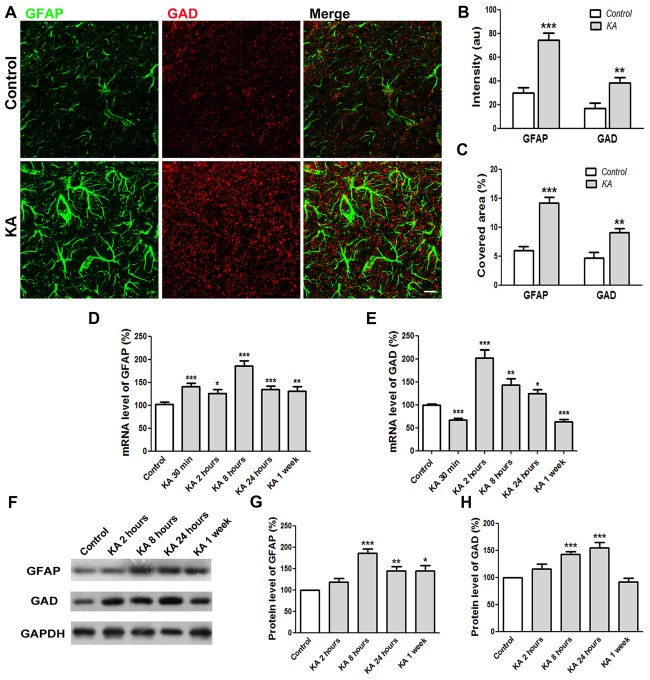
Figure 5.
The expression levels of GFAP and GAD increased 24 h after KA injection. (A) Co-immunostaining of GFAP (green) and GAD (red) in the cortex of saline-injected control or KA-injected mice at 24 h after injection. (B) The quantification of immunofluorescence intensity (n = 12 slices from three mice). (C) Quantification of immunostaining signal covered area (n = 12 slices from three mice). (D,E) The mRNA levels of GFAP and GAD were determined by qRT-PCR 24 h after saline or KA injection (n = 9). (F) Western blot analysis to determine the protein levels of GFAP and GAD in the cortex of control or KA-injected mice. (G,H) Quantification of GFAP and GAD protein level changes after KA injection (n = 6–8). Scale bar = 10 μm. *P < 0.05, **P < 0.01, ***P < 0.001.

