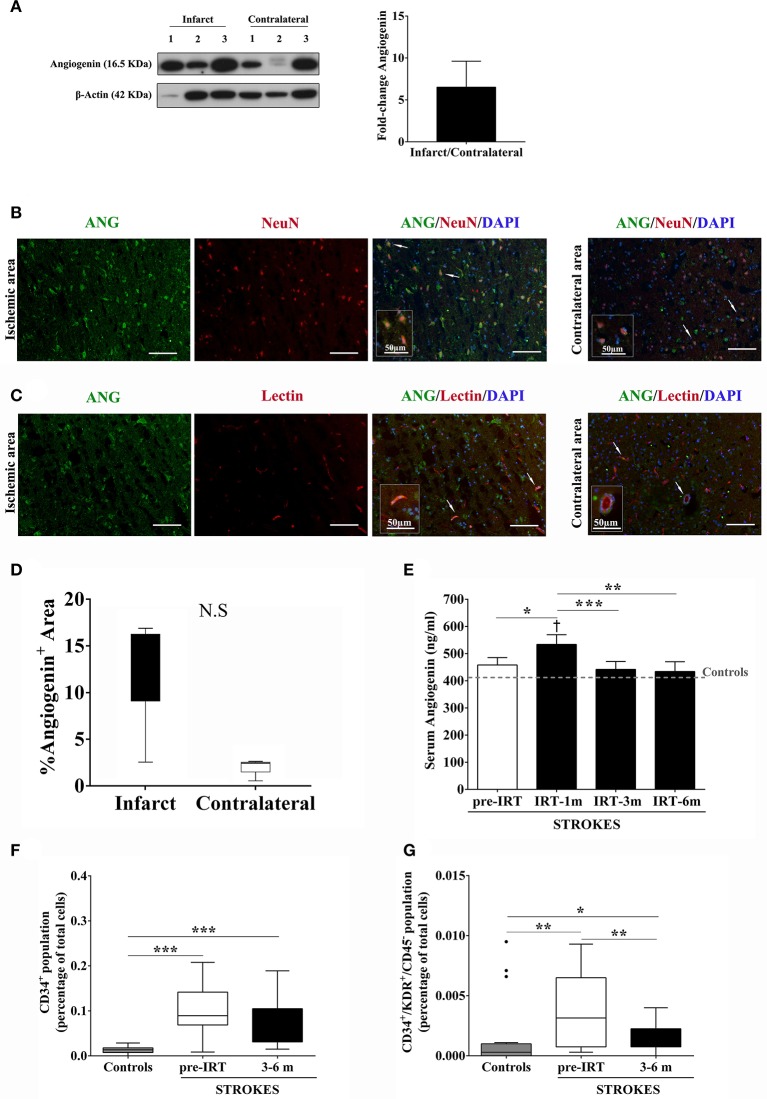
Figure 3.
Angiogenin and EPCs modulation after human stroke and rehabilitation. (A) Infarct tissue and contralateral brain homogenates (≤ 4 days) were analyzed by western blot for angiogenin (n = 3). The densitometry results (arbitrary units) were corrected by the actin load and bar graph showing the angiogenin fold-change of the ipsilateral vs. contralateral signal. (B,C) Representative immunofluorescence images of ischemic and contralateral areas, respectively, of stroke patients showing angiogenin+/NeuN+ cortical neurons and angiogenin+/lectin+ vessels. (D) Box plots representing the percentage of the fluorescent Angiogenin+ area in infarcted and non-infarcted brain samples from stroke patients (n = 3). (E) Bar graphs showing the temporal profile of serum angiogenin levels during IRT. *p < 0.05; **p < 0.01, and ***p < 0.001; p < 0.05 vs. Controls (Controls n = 13; Strokes in IRT n = 15–18). (F,G) Box plots representing cell populations with angiogenic potential such as CD34+ and CD34+/KDR+/CD45− cell populations; *p < 0.05, **p < 0.01, ***p < 0.001; Controls n = 17 and Strokes in IRT n = 15–17. Bar graphs are represented as the mean ± SEM, and box plots are represented as the median (IQR). NS, Non-significant; IRT, intensive rehabilitation therapy; m, month.

