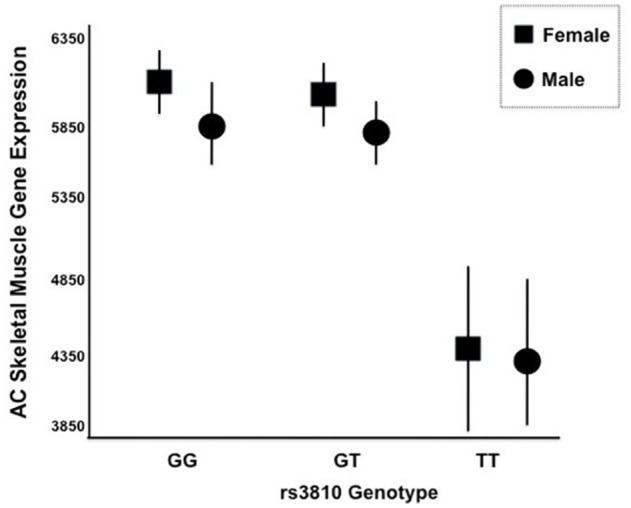
Figure 5.

mRNA Expression of ASAH1 Stratified by rs3810 Genotype. Two distinct Affymetrix probe sets indicated that ASAH1 mRNA expression is significantly different by rs3810 genotype using either full (p = 0.006–0.007) or dominant (p = 0.01–0.02) models, using sex and race as covariates. Females are represented by rectangles and males are represented by circles. TT individuals demonstrated 1.3–1.4 times lower skeletal muscle acid ceramidase expression than did GG individuals at baseline.
