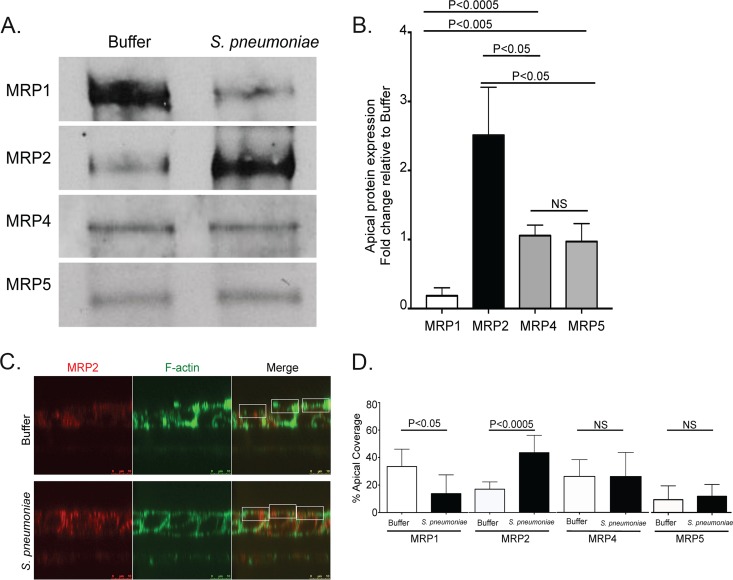
FIG 1 .
MRP1 protein on the apical surface reduces during infection with Streptococcus pneumoniae, while MRP2 increases. The apical surface examination of mock-infected or S. pneumoniae serotype 4 (TIGR4)-infected polarized H292 cells. The cells were treated with HBSS (Buffer) or infected (S. pneumoniae), washed, and allowed to rest at 37°C for 1 h postinfection. (A) Apical surfaces were then labeled with biotin and lysed. Samples were normalized to protein content against a BSA standard, exposed to streptavidin beads, and subjected to sodium dodecyl sulfate-polyacrylamide gel electrophoresis (SDS-PAGE). The blots were probed with primary antibodies for the selected proteins. A representative Western blot of apical biotinylation probing MRP expression is shown. (B) Densitometry of pooled Western blot samples from multiple experiments. Statistics calculated using two-tailed Student’s t test compared with MRP4 or MRP5 (n = 3). (C) Buffer-treated or infected cells were fixed and stained for MRP2 and F-actin. Immunofluorescence cross-section Z-stack images of F-actin were utilized to identify cellular borders and apical surface (green). The corresponding region of MRP2-stained Z-stack (red) was marked for the particular region of interest (white boxes) and calculated for the total apical coverage using ImageJ. (D) The calculated percentage of the area taken up by the indicated MRPs in panel C via calculations completed with ImageJ (see Materials and Methods). P values were calculated using two-tailed Student’s t test comparing the percentages for the given protein in uninfected and infected cells (n = 8). Values that are not significantly different (NS) are indicated. Quantification samples for biotinylation and immunofluorescence were taken from at least two separate infections with similar results.

