FIG 3 .
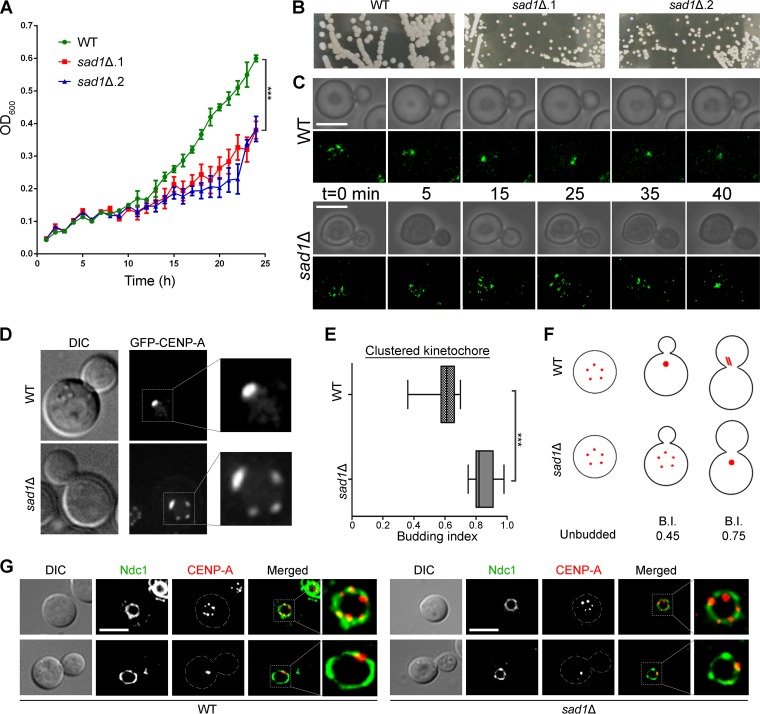
Kinetochore clustering is delayed in the sad1 null mutant. (A) A graph showing the growth rates of wild-type and sad1Δ mutant cells (P < 0.0001). (B) Plate images showing the colonies formed by both the wild type and the sad1Δ mutants on the YPD plates after 4 days. The images shown were captured at the same magnification. (C) Time-lapse imaging showing kinetochore clustering in both wild-type and sad1Δ mutant cells (n = 5). Bars, 5 µm. (D) Snapshots depicting the status of the kinetochore clustering in the mutant and wild-type cells of a similar budding index. (E) The kinetochore clustering status was correlated with the budding index (BI) and was plotted for cells with the clustered kinetochores (n = 50). As shown, kinetochore clustering was delayed in the mutant and took place only when cells attained a BI of 0.7, while it occurred at a BI of 0.4 in the wild-type cells (P < 0.0001). (F) A cartoon depicting kinetochore clustering dynamics in both the wild type and the sad1Δ mutant. (G) Localization of the kinetochore (mCherry–CENP-A) with respect to the nuclear envelope (GFP-Ndc1) does not change in sad1 null cells compared to the wild-type cells, in both interphase and mitotic cells.

