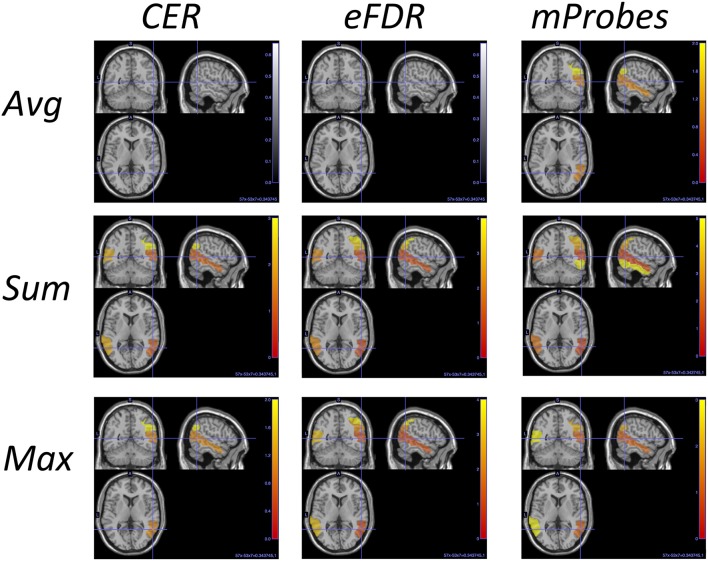
Figure 11.
AAL regions selected with each method and each aggregation function for and T = 10, 000. This picture is a visual representation of Table 4. The blob color provides information about the ranking: the more red the region is the better is its rank.

