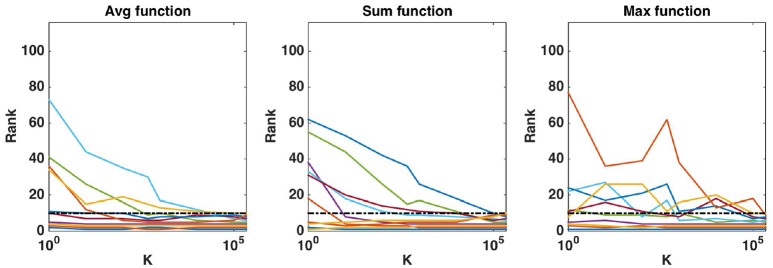
Figure 8.
Real dataset. Evolution of the rank as a function of K parameter value (in log scale) for the first ten regions obtained (T = 10, 000 and K = p). Importance scores are computed for the AAL atlas and for each aggregation function. Black horizontal dotted line represents the 10th ranking position.

