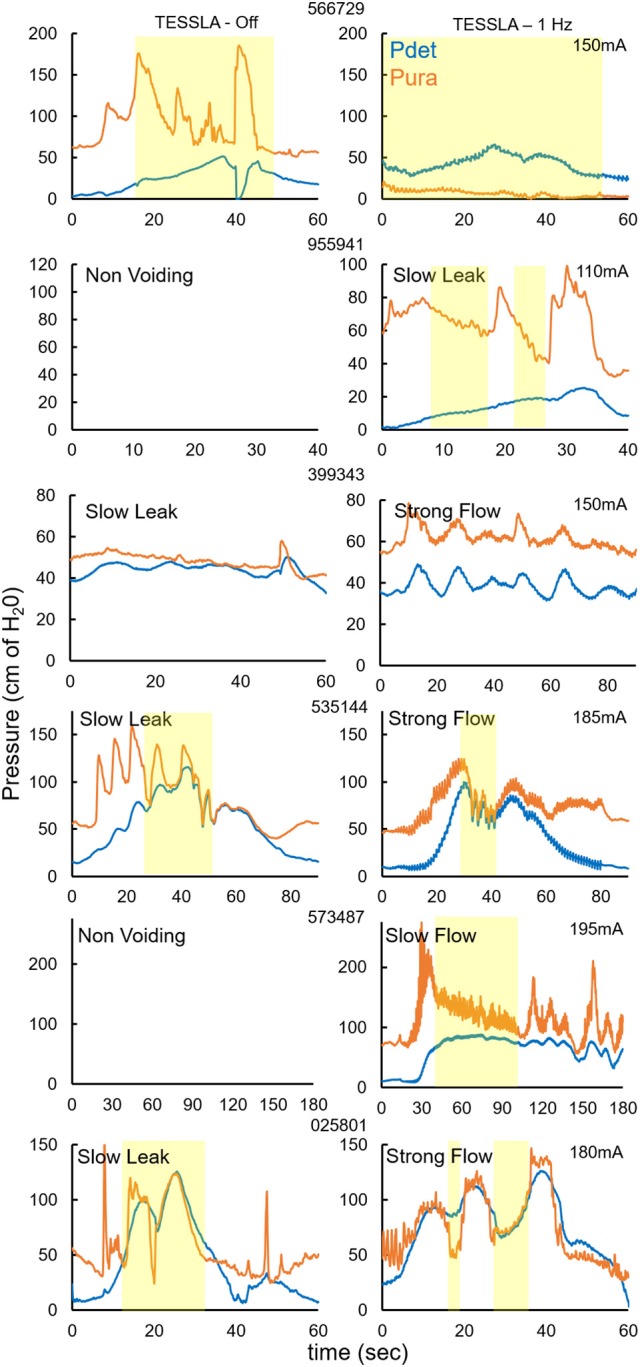
Figure 3.

Pdet and Pura during voiding without and with TESSLA (1 Hz) for the 6 individual subjects. Yellow highlight identifies the region of voiding. Note: 2 subjects (955941, 573487) demonstrated a non-voiding responses during TESSLA Off, thus the pressure traces are not included.
