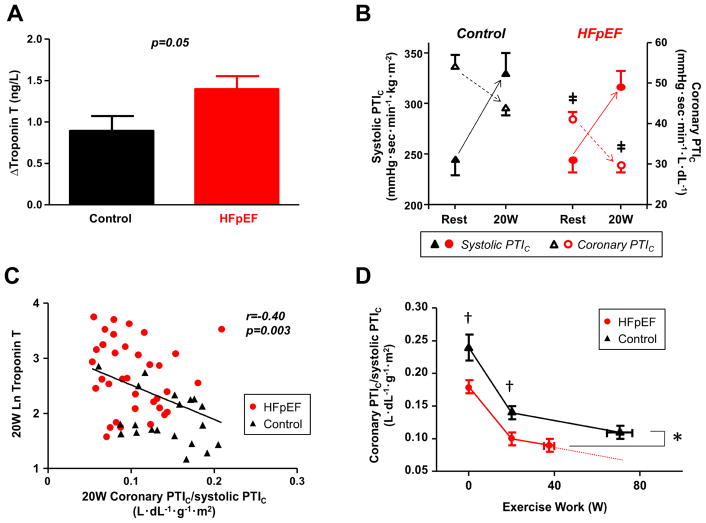
Figure 3. Myocardial Injury and Oxygen Supply-Demand Relationships during Exercise.
(A) Compared to controls, subjects with HFpEF developed greater increase in troponin T levels during low-level exercise. (B) At rest, systolic PTIC was similar in HFpEF and controls but coronary perfusion PTIC was significantly reduced in the HFpEF group, resulting in imbalance between myocardial O2 supply and demand. With low-level (20W) exercise, systolic PTIC increased while coronary perfusion PTIC decreased. As compared to controls, coronary perfusion PTIC remained significantly lower in HFpEF subjects during exercise. ‡p<0.001 vs. controls. (C) Troponin T levels were correlated with lower coronary PTIC/systolic PTIC ratio at 20W exercise. (D) Coronary PTIc/systolic PTIc ratio as a function of workload. Group differences in the ratio were slightly attenuated at peak exercise, likely due to the differing absolute workloads achieved, but remained significant. Solid lines depict measured data, and the dotted line depicts the hypothetical values if HFpEF subjects had been able to reach the same workload at peak as the control subjects based upon the trajectory of change. *p<0.05 vs. controls; †p<0.01 vs. controls. Coronary PTIC indicates the product of coronary perfusion pressure time integral PTI and arterial oxygen content; systolic PTIC, the product of systolic PTI and LV mass index to adjust for differences in LV wall stress; and other abbreviations as in Figures 1 and 2.

