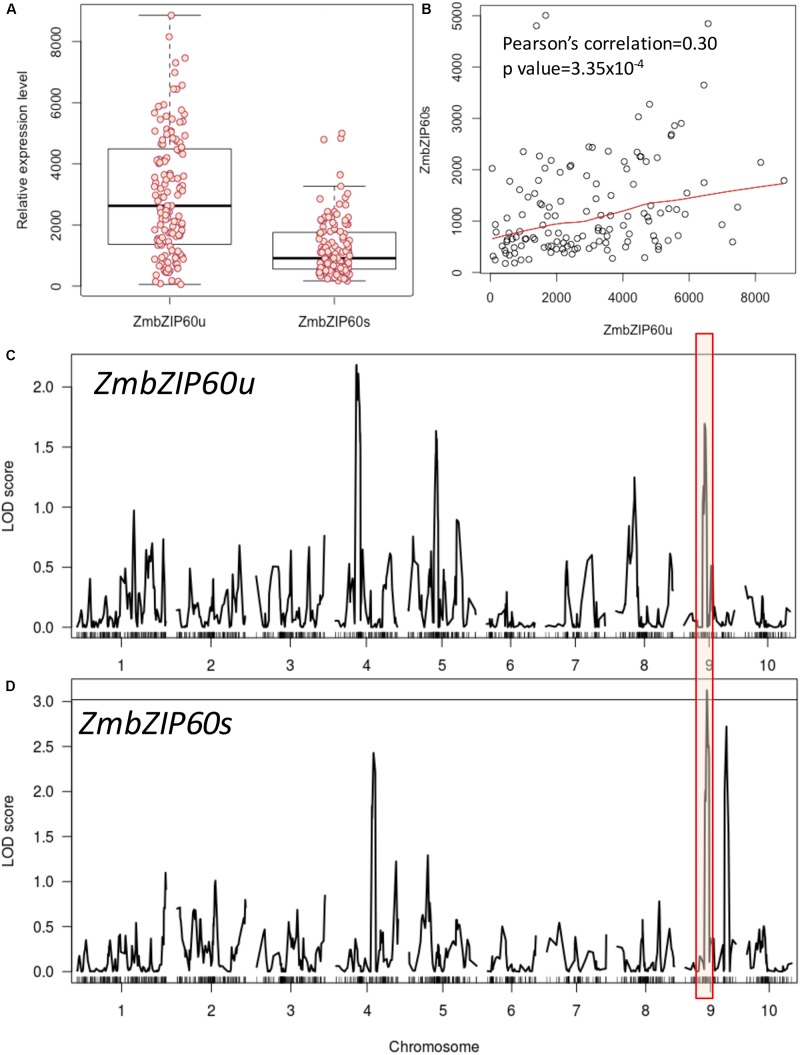
FIGURE 1.
QTL analysis of heat-induced ZmbZIP60 expression in NAM RILs. RILs were derived from a cross of B73 × CML52, and relative gene expression values were determined by ImageJ measurements of band density from a RT-PCR analysis. (A) Box plot of the relative heat-induced gene expression levels in the various RILs for unspliced form of ZmbZIP60 mRNA (ZmbZIP60u) and the spliced form (ZmbZIP60s). Dark horizontal lines are the means of the gene expression levels, the box indicates the standard deviation values and the whiskers are the limits of variation in the levels of expression. (B) Correlation between the heat-induced levels of ZmbZIP60u and ZmbZIP60s in the various RILs. (C) Association analysis to map heat-induced ZmbZIP60u QTLs onto the maize B73 genome. Major peak boxed in red marks the vicinity of the ZmbZIP60 gene. (D) Similar association analysis mapping the heat-induced ZmbZIP60s expression QTLs. Line indicates significant LOD 3 score.

