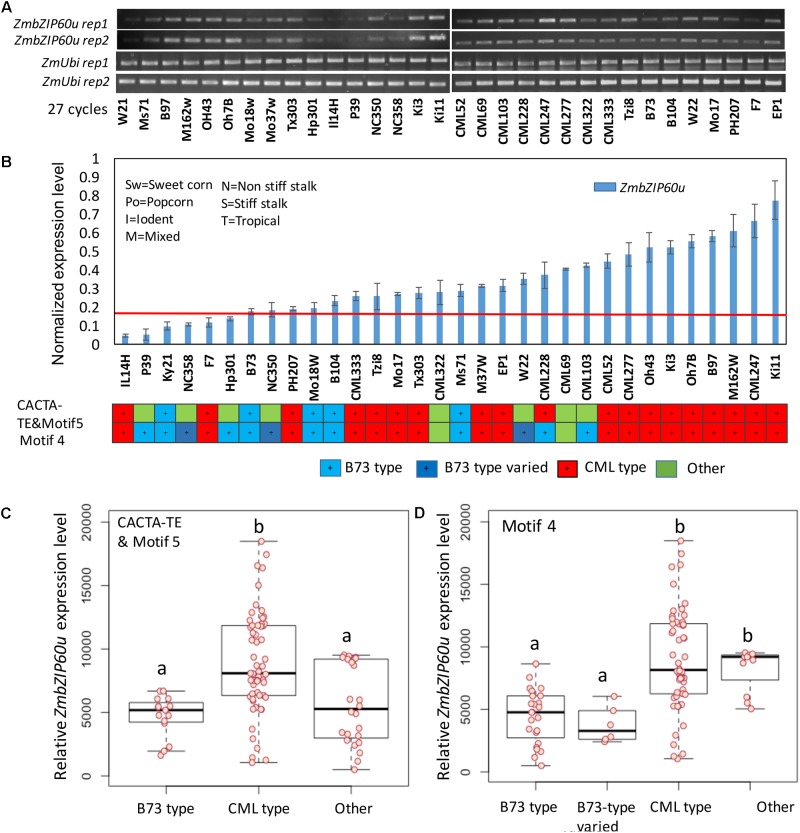
FIGURE 5.
Correlation between promoter type and the level of heat-induced ZmbZIP60u expression. (A) RT-PCR analysis of the expression of ZmbZIP60u expression in 32 various maize NAM founder and reference lines. (B) The levels of expression were evaluated using ImageJ, and normalized with respect to the levels of ubiquitin. The maize lines were rank ordered by their level of heat-induced ZmbZIP60u expression. Also indicated are the heterotic groups in which these lines are classified. Error bars = SD for four biological replicates including the two shown above. (C) Box plot showing the heat-induced levels of ZmbZIP60u expression in lines characterized as having B73, CML, or other type promoters based on CACTA-TE and motif 5. Horizontal black line is the mean level of expression, the box indicates the standard deviation and the whiskers show the maximum variance. (D) As in C, the box plot shows the heat-induced levels of ZmbZIP60u expression in lines with type promoters based on motif 4. One-way ANOVA analysis and multiple comparisons were performed using Tukey test of the data in C,D and listed in Supplementary Figure S3. Letters a and b indicate significant differences between groups.

