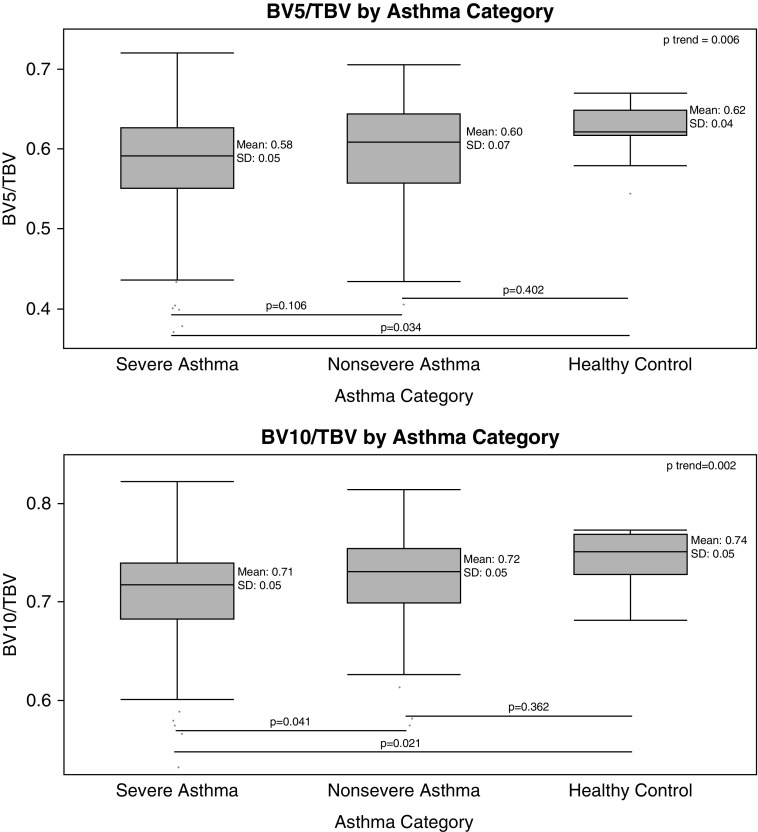
Figure 2.
Pruning by asthma disease severity. Severe asthma was defined on the basis of American Thoracic Society/European Respiratory Society guidelines, and mild–moderate asthma was defined on the basis of National Asthma Education and Prevention Program guidelines (20–23). In box plots, the box portion represents the 25th to the 75th percentile with the solid mid-line representing the mean, and the whisker portion represents the 2.5th to the 97.5th percentile. P values for pairwise comparisons shown below the box plots are based on the Steel-Dwass-Critchlow-Fligner method (53). P trend values are based on the Jonckheere-Terpstra test. BV5 = blood vessel volume of vessels less than 5 mm2 in cross-sectional area; BV10 = blood vessel volume of vessels less than 10 mm2 in cross-sectional area; TBV = total pulmonary blood vessel volume.

