-
A
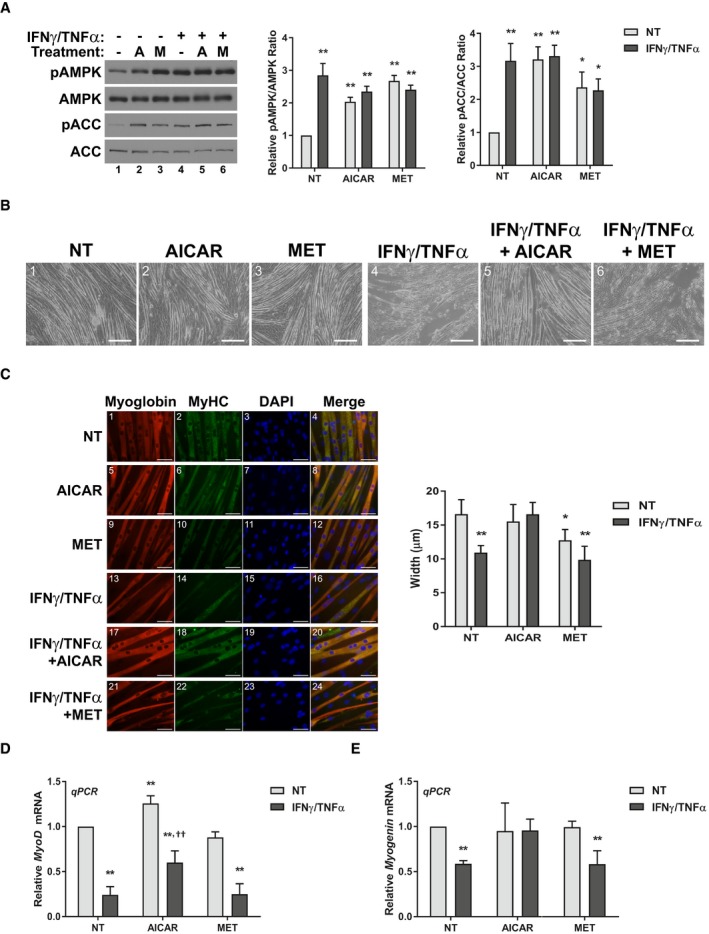
Western blotting for phospho‐Thr172‐AMPK (pAMPK), total AMPK, phospho‐Ser79‐ACC (pACC), and total ACC 24h after treatment. Quantification represents the pAMPK/AMPK and pACC/ACC ratios relative to the non‐treated (NT) control.
-
B
Phase contrast images of fibers 72 h after treatment. Scale bars represent 0.25 mm.
-
C
Immunofluorescence staining for myoglobin and myosin heavy chain (MyHC) 48 h after treatment. Scale bars represent 50 μm. Quantification represents the average myotube width.
-
D, E
RT–qPCR analysis of the mRNA levels of MyoD (D) and myogenin (E) 24 h after treatment relative to the NT control.
Data information: All quantifications are of three independent experiments (
n = 3) and error bars represent standard error of the mean (SEM). Significance between means was first determined using ANOVA. Significance
P‐values were calculated using Fisher's LSD. *
P < 0.05; **
P < 0.01 from NT controls;
††
P < 0.01 from IFNγ/TNFα‐treated controls.
Source data are available online for this figure.