-
A
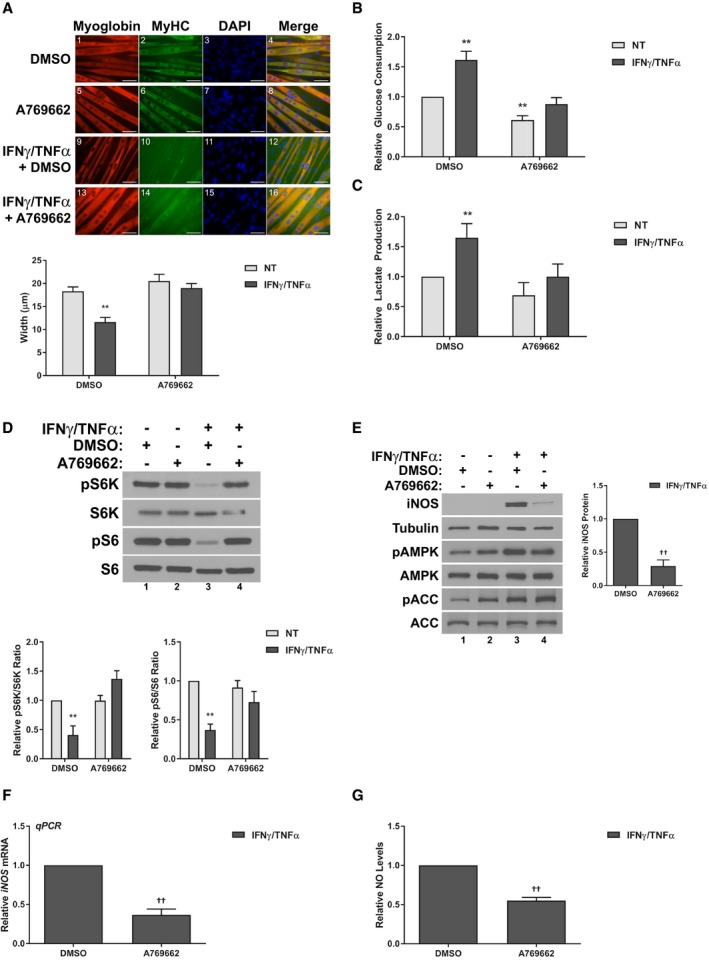
Immunofluorescence staining for myoglobin and myosin heavy chain (MyHC) 48 h after treatment. Scale bars represent 50 μm. Quantification represents the average myotube width.
-
B,C
Rates of glucose consumption (B) and lactate production (C) measured in the media 24 h after treatment relative to the DMSO‐treated control.
-
D
Western blotting of phospho‐Thr389‐p70S6K (pS6K), total p70S6K (S6K), phospho‐Ser235/236‐S6 (pS6), and total S6. Quantification represents the pS6K/S6K and pS6/S6 ratios relative to the DMSO‐treated control.
-
E
Western blotting of iNOS, tubulin, phospho‐Thr172 AMPKα (pAMPK), total AMPKα (AMPK), phospho‐Ser79‐ACC (pACC), and total ACC. Quantification represents the levels of iNOS protein normalized to tubulin and relative to the IFNγ/TNFα control.
-
F
RT–qPCR analysis of iNOS mRNA levels relative to the IFNγ/TNFα control 24 h after treatment.
-
G
Nitric oxide (NO) levels in the culture media of cells relative to the IFNγ/TNFα control 24 h after treatment.
Data information: All quantifications are of three independent experiments (
n = 3), and error bars represent the SEM. For panels (A–D), significance between means was first determined using ANOVA. Significance
P‐values were calculated using Fisher's LSD. For panels (E–G),
P‐values were calculated using the Student's
t‐test. *
P < 0.05; **
P < 0.01 from DMSO controls;
††
P < 0.01 from IFNγ/TNFα‐treated controls.
Source data are available online for this figure.