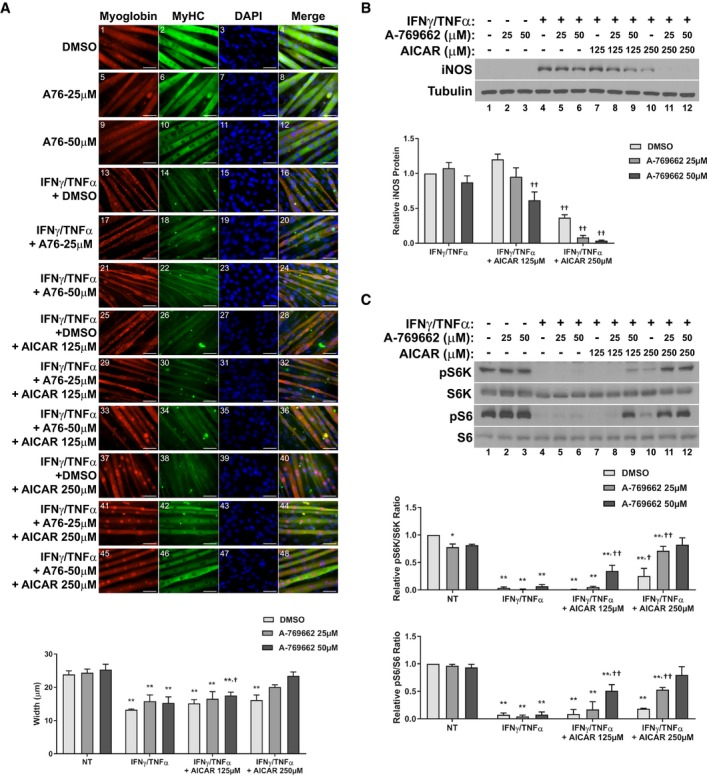
Immunofluorescence staining for myoglobin and myosin heavy chain (MyHC) 48 h after treatment. Scale bars represent 50 μm. Quantification represents the average myotube width.
Western blotting for iNOS and tubulin protein levels 24 h after treatment. Quantification represents the levels of iNOS protein normalized to tubulin and relative to the IFNγ/TNFα control.
Western blotting of phospho‐Thr389‐p70S6K (pS6K), total p70S6K (S6K), phospho‐Ser235/236‐S6 (pS6), and total S6. Quantification represents the pS6K/S6K and pS6/S6 ratios relative to the NT control.
Data information: All quantifications are of three independent experiments (
n = 3), and error bars represent the SEM. Significance between means was first determined using ANOVA. Significance
P‐values were calculated using Fisher's LSD. *
P < 0.05; **
P < 0.01 from non‐treated (NT) controls;
†
P < 0.05;
††
P < 0.01 from IFNγ/TNFα‐treated controls.
Source data are available online for this figure.