
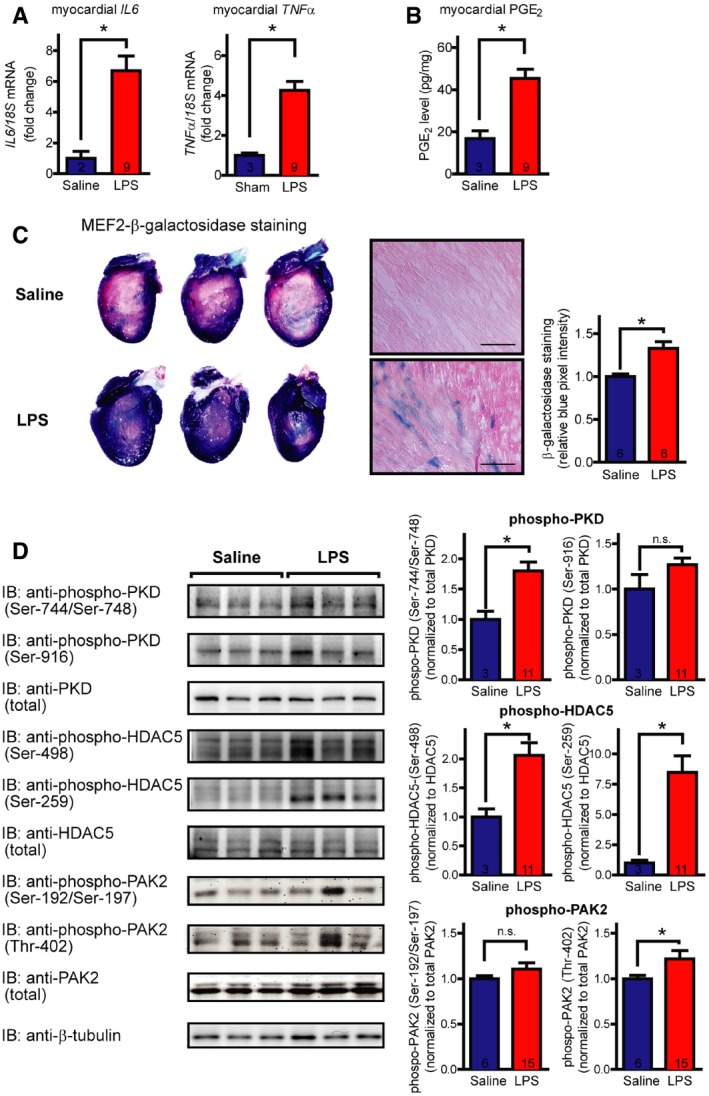
Figure 7. LPS‐induced endotoxemia leads to myocardial inflammation, increased myocardial PGE 2 levels, and MEF2 activation.
MEF2‐lacZ reporter mice (BALB/c background, 6–12 weeks old) were treated with 7 mg/kg lipopolysaccharide from Escherichia coli (O111:B4) or saline intraperitoneally and were sacrificed after 24 h.
- mRNA levels of different inflammatory cytokines, as indicated. The graphs show relative mRNA levels, fold increase compared to saline‐treated controls, normalized to 18s content.
- PGE2 was quantified after mechanical homogenization of deeply frozen hearts using nano‐liquid chromatography‐tandem mass spectrometry.
- Histologic and macroscopic stainings of β‐galactosidase activity in MEF2‐lacZ reporter mice show MEF2 activation (blue cells and precipitates, respectively) in the myocardium upon LPS treatment. Saline‐treated littermates served as control. Scale bar of histological stainings is 100 μm. Quantification of whole‐heart stainings is shown in the right panel (pixel intensity in blue channel normalized to total intensity).
- Induction of PKD, HDAC5, and PAK2 in myocardial inflammations. Immunoblots were performed on extracts of hearts of saline‐ and LPS‐treated mice. Representative blots are shown in the left panel, and the quantification is in the right panel.