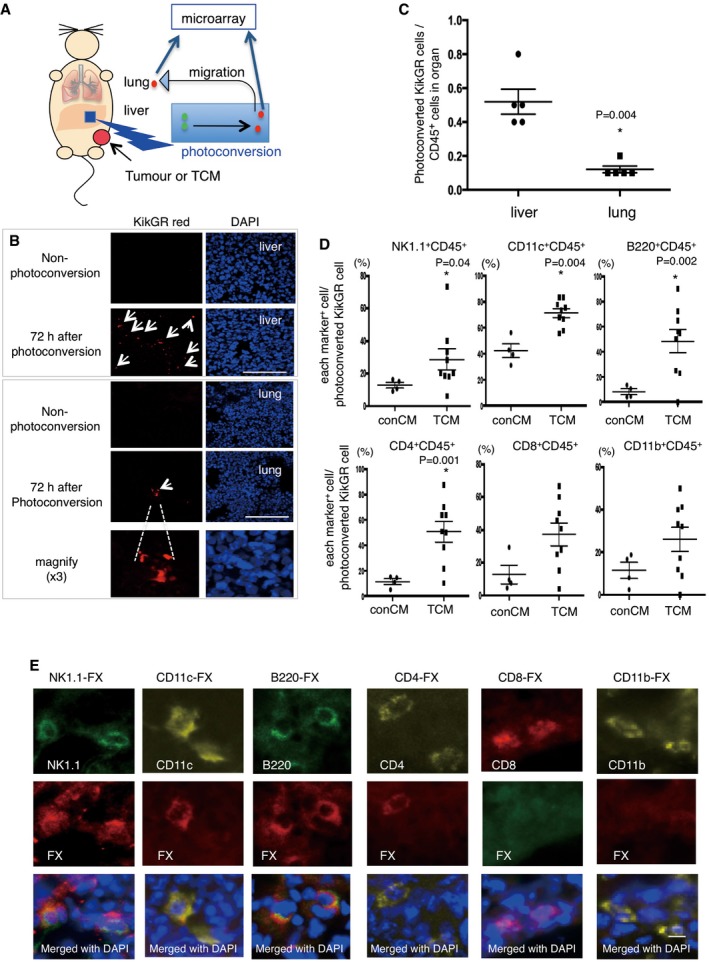
Figure 2. In vivo tracking of HepELs in a primary tumour‐stimulated mouse.

-
AAn experimental tracing model of CD45+ leucocytes in “KikGR” mice using a photoconversion system. Colour conversion from KikGR green‐to‐KikGR red occurred in liver cells upon violet light irradiation. In the tumour‐bearing‐ or tumour‐conditioned media (TCM)‐stimulated KikGR mice, and the cells later moved into the lungs. The KikGR red cells, obtained from TCM‐stimulated liver and lungs, were isolated by a cell sorter and CD45 microbeads, and these purified cells were used for microarray screening.
-
BKikGR red cells were detected in the TCM‐stimulated liver and lungs after liver exposure to violet light (arrow). Images taken from animals with no light exposure were also shown (scale bar, 100 μm).
-
CFlow cytometric quantifications of photoconverted HepELs in TCM (three times)‐stimulated KikGR mouse liver and lungs. Cells were isolated 72 h after photoconversion. Ratio was calculated as the number of photoconverted cells (KikGR red) observed in the region (gated in Fig EV1) in comparison with the number of liver or lung cells pre‐sorted with CD45‐beads. Shown are averages (N = 5) with SEM and Welch's t‐test.
-
DSurface marker analyses of photoconverted KikGR cells. Vertical axes represent ratio of each marker+ cell/photoconverted KikGR cell. Shown are averages (conCM, control: N = 4, TCM: N = 9) with SEM and Welch's t‐test.
-
ERepresentative immunostaining images of FX expression in NK1.1+, CD11c+, B220+ and CD4+ cells in tumour‐bearing lungs (scale bar, 10 μm).
