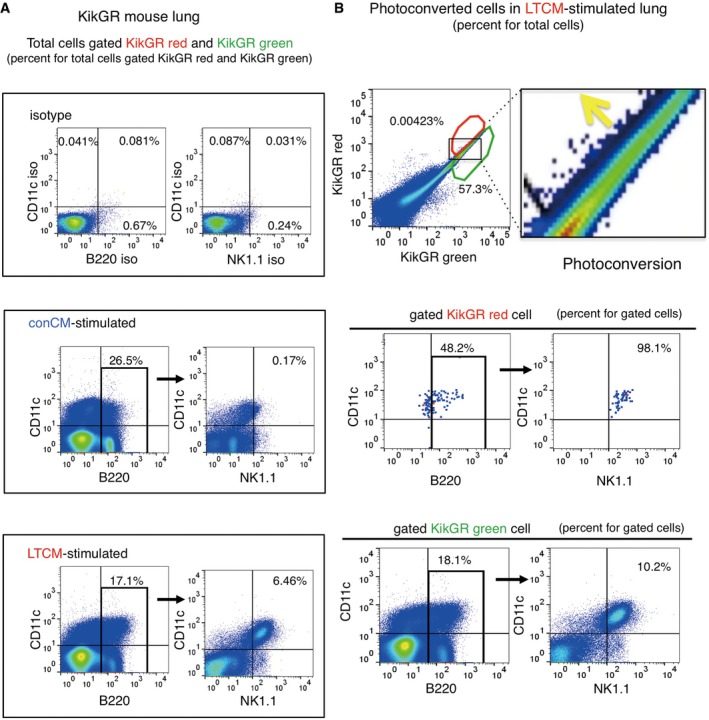
Figure 3. Relocation of B220+CD11c+NK1.1+HepELs in pre‐metastatic lungs.

-
AFlow cytometric analysis of B220+CD11c+NK1.1+ cells in the lung of TCM‐stimulated mice. Values in the dot plots present ratios for total cells gated KikGR red and KikGR green cell.
-
BRepresentative flow cytometric analyses of the relocation of B220+CD11c+NK1.1+ cells in lungs that were photoconverted in TCM‐stimulated KikGR mouse liver (gated in red polygonal region). Percent is shown for total cells (upper panel) and for gated KikGR red or KikGR green cells (middle and lower panels). Region where the photoconverted cells locate is magnified in the right. Yellow arrow shows the photoconversion direction. Three independent experiments. LTCM stands for TCM derived from LLC.
