FIGURE 2.

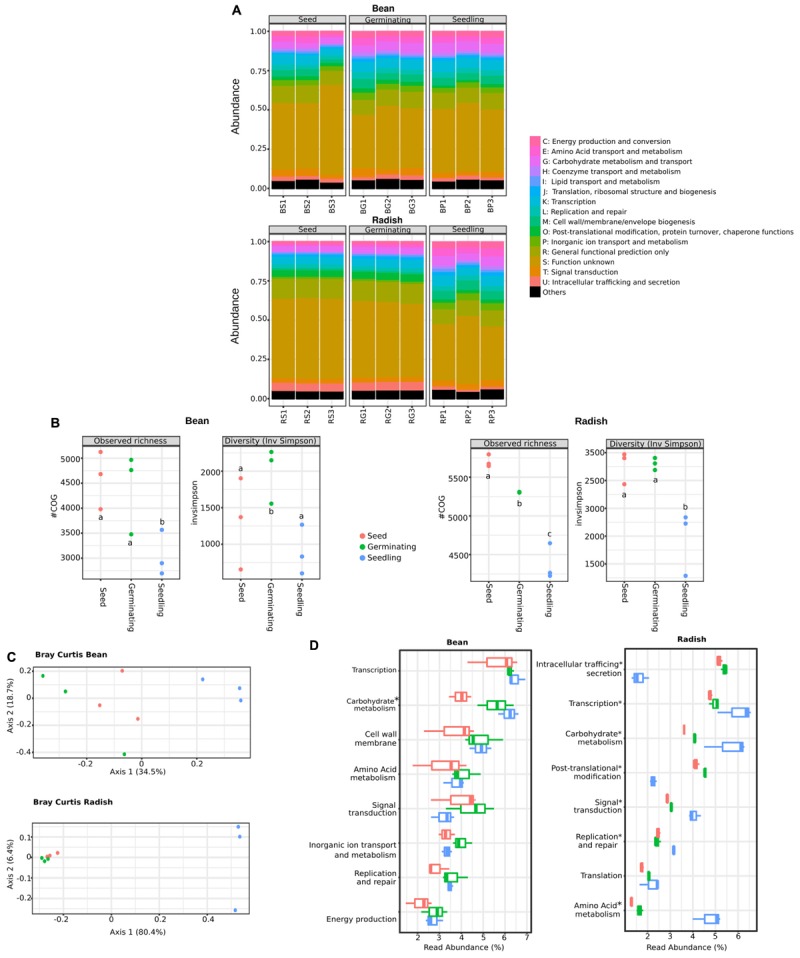
Functional composition of microbial assemblages associated to seeds, germinating seeds and seedlings. (A) Relative abundance of COGs functional categories in the predicted proteomes of the samples investigated. (B) Changes in COGs richness (left panels) and diversity (right panels) among the samples investigated. Letters indicate differences between individual means as assessed with one factor ANOVA with post hoc Tukey HSD (P < 0.01). (C) PCoA plots based on Bray-Curtis index calculated on COGs table. (D) Abundant functional categories in the samples investigated. Of note is that the functional categories S (function unknown) and R (general functional prediction only) were not reported in this panel. Asterisks (∗) indicate taxa that are significantly more abundant in seedling samples in comparison to seeds [ANOVA with post hoc Tukey HSD (P < 0.05)].
