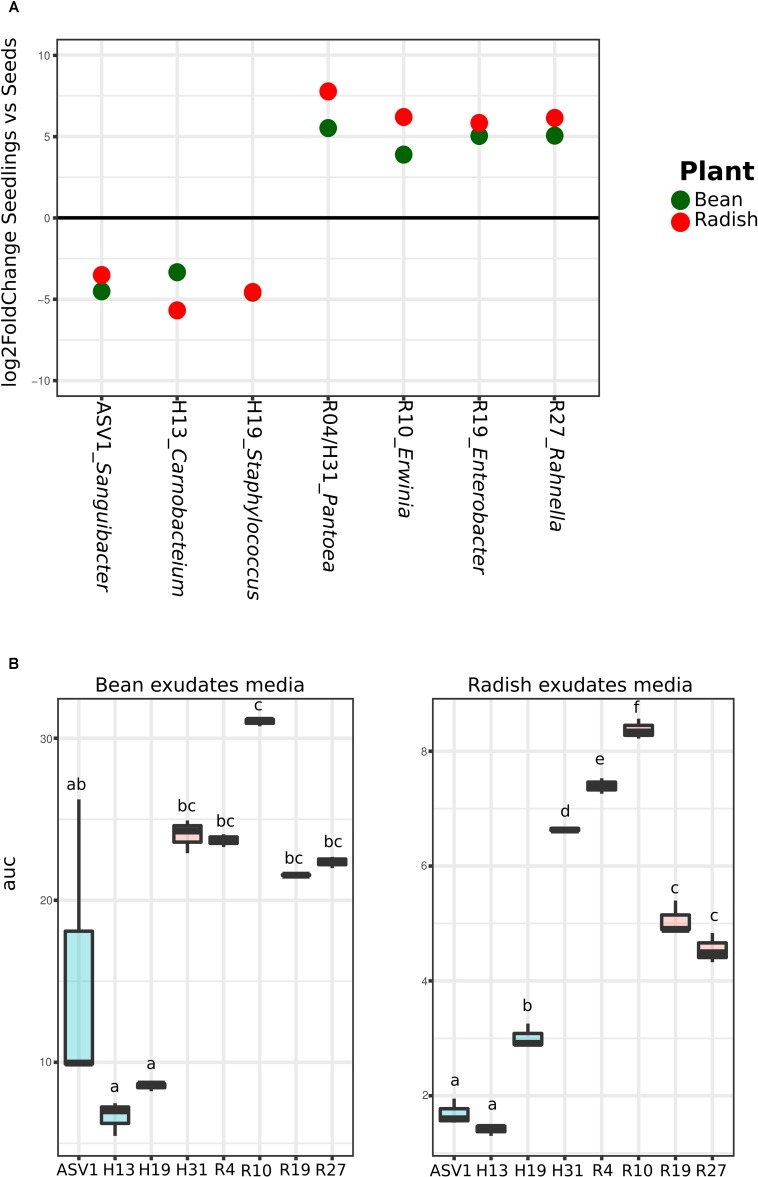
FIGURE 4.
Quantification of seed-associated bacteria potential growth on bean and radish seed exudates. (A) Metagenomics reads relative abundance Log2fold change in seedlings in comparison to seeds of the nine selected taxa according to DeSeq2. (B) Area under the growth curve (optical density [OD] in time) as a marker of the potential growth of the different bacteria strains. Letters indicate differences between individual means assessed with one factor ANOVA with post hoc Tukey HSD (P < 0.05).

