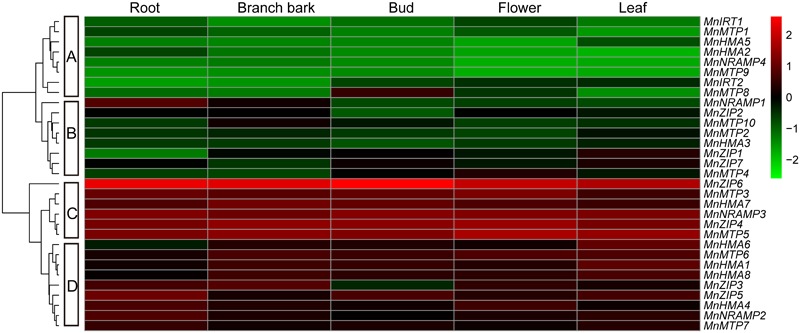
FIGURE 2.

The transcript levels of four Morus transporter gene families in five tissues. The transcript levels were depicted by color scale representing log10 values. The values were centered and scaled in the column direction. Red denotes high expression and green denotes low expression.
