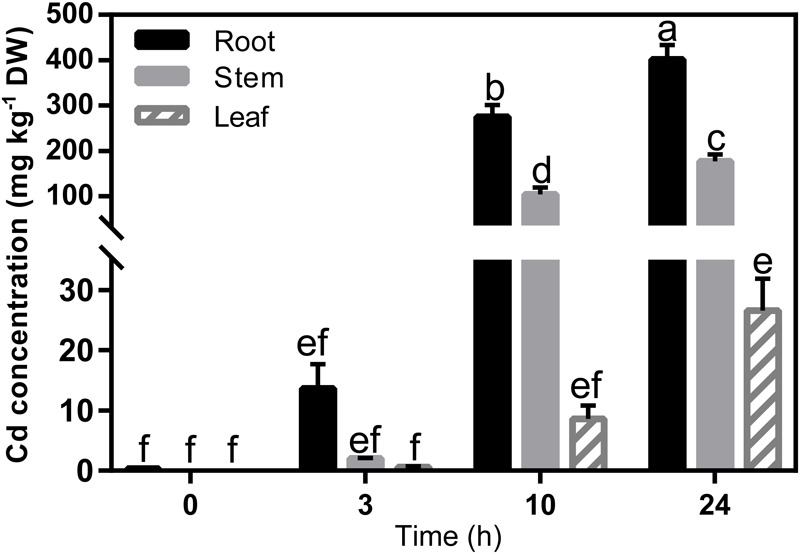
FIGURE 3.

Cd concentration in root, stem and leaf tissues of Ma-GY62 seedlings within 24 h of exposure to soil treated with 100 μM CdCl2. Values are the means ± standard error (n = 3) for the different parts of the plant. Any two samples with a common letter are not significantly different, according to Tukey’s test (P > 0.05).
