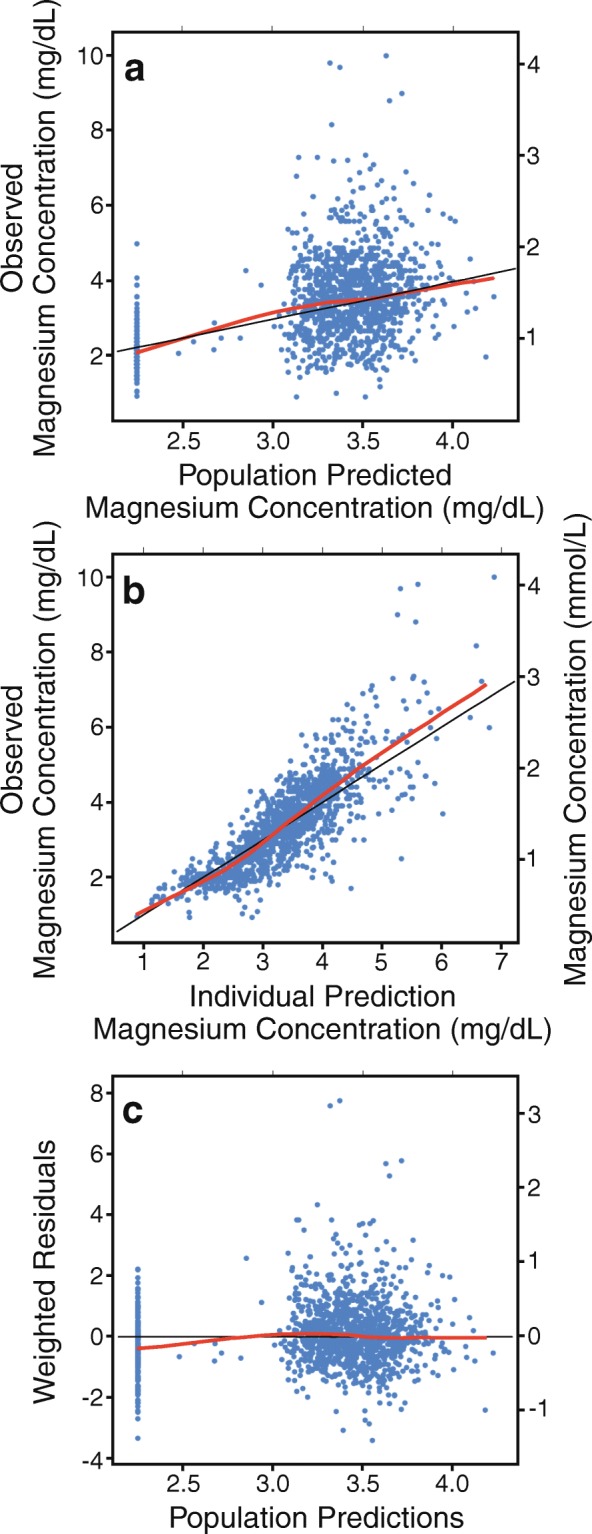
Fig. 2.

Observed vs. predicted magnesium concentrations in final model. The RED line represents the regression results. The BLACK line is the line of unity where X = Y

Observed vs. predicted magnesium concentrations in final model. The RED line represents the regression results. The BLACK line is the line of unity where X = Y