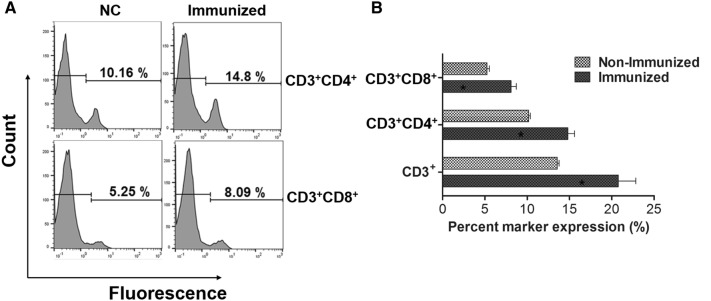
Figure 5.
FACS analysis of splenic T lymphocytes. A Representative flow cytometry histogram plots for CD4+ and CD8+ splenic T cell populations. B Change in the T cell subpopulation in the control mice and immunized mice. Error bars indicate the sd. *P < 0.05 when the values were compared with those of non-immunized mice.

