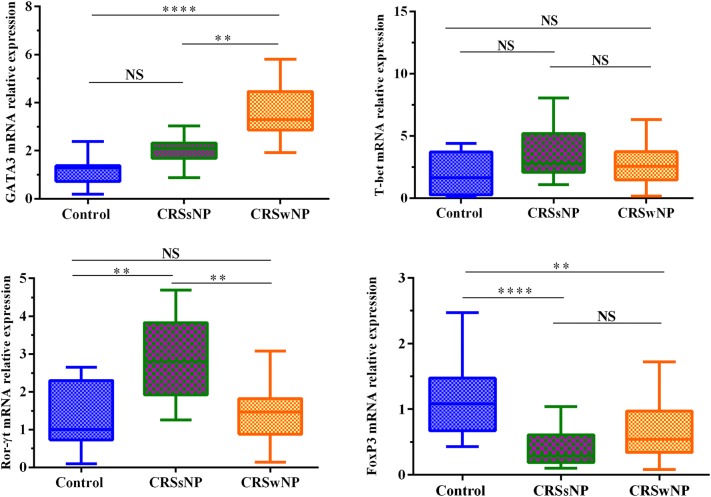
Fig. 5.
The expression levels of GATA3, T-bet, Ror-γt, and FoxP3 in controls, CRSsNP and CRSwNP patients. GATA3 was increased in CRSwNP patients, Ror-γt was increased in CRSsNP patients, and FoxP3 was decreased in CRS patients. No significant difference was reported for T-bet mRNA expression among three groups. The Kruskal–Wallis H test was used to assess significant intergroup variations

