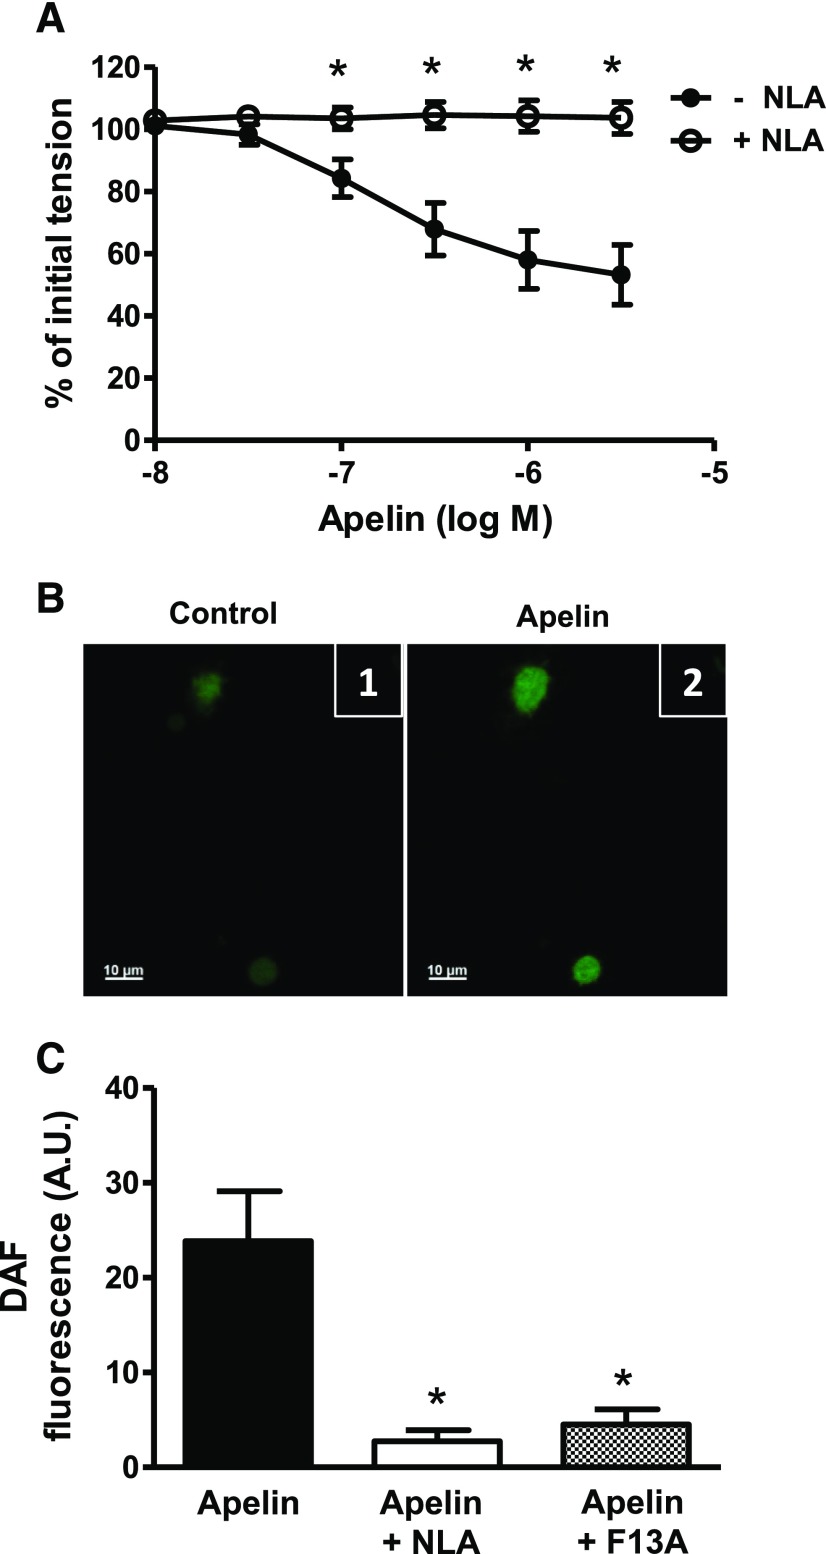
Fig. 3.
Role of NO in apelin-induced relaxation of coronary arteries. (A) Log concentration-response curve for apelin in producing relaxation of endothelium-intact coronary arteries in the absence and presence of NLA (3 × 10⁻⁵ M, n = 6). (B) Representative images of freshly isolated coronary endothelial cells loaded with DAF-2 (5 µM) (1) before and (2) after exposure to apelin (10−7 M). (C) Bar graph representing increase in DAF-2 fluorescence after exposure to apelin (10−7 M) in the absence and presence of NLA (3 × 10⁻⁵ M) or F13A (10−7 M). Amplitude of change in DAF-2 fluorescence was calculated as the maximal fluorescence after agonist exposure, corrected for baseline fluorescence. Values are represented as the mean ± S.E.M. (n = 4–6). *P < 0.05 vs. apelin alone as calculated by analysis of variance using the Tukey test as post hoc analysis. A.U., arbitrary unit.

