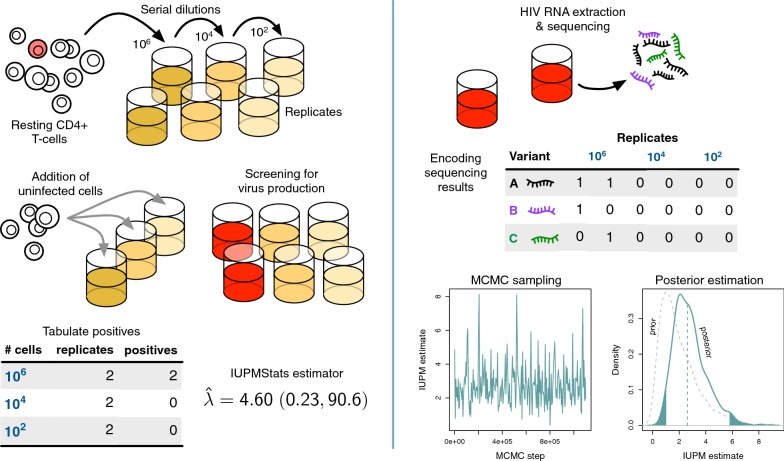
Fig. 1.
Schematic diagrams of experimental and data analysis procedures. (Left panel) Resting CD4+ T cells sampled from an HIV+ patient are serially diluted in replicate culture wells. Uninfected cells are added to the culture wells to amplify viral outgrowth (red). IUPMStats estimates the rate parameter of the single-hit Poisson model from the numbers of positive wells at varying dilutions. (Right panel) HIV-1 RNA is extracted from each positive well and amplified for library construction and sequencing. The presence/absence of different sequence variants are tabulated and used to fit a multi-target Poisson model by Markov chain Monte Carlo (MCMC) sampling, in which a prior distribution on the IUPM (lower right, grey dashed curve) is updated by the data to estimate the posterior distribution (solid curve)

