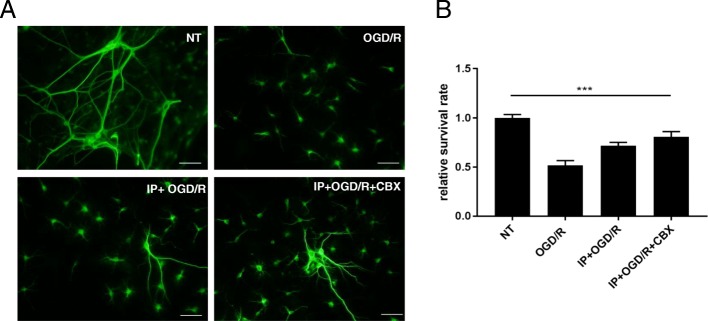
Fig. 2.
The effect of CBX on neurons. a Representative deconvolution fluorescence images of neuron cultures. Neurons were stained with an anti-MAP-2 antibody (green). Neuron cultures were treated with OGD/R, OGD/R with preconditioning, and OGD/R with CBX and IP, at 6 h after re-oxygenation. Scale bar = 50 μm. b Neuronal survival rate was quantified. The viability of non-treated neurons (NT) was normalized to 1.0. Each column shows the mean ± SEM (n = 5). ***P < 0.001 compared to the survival rate of non-treated neuron cultures

