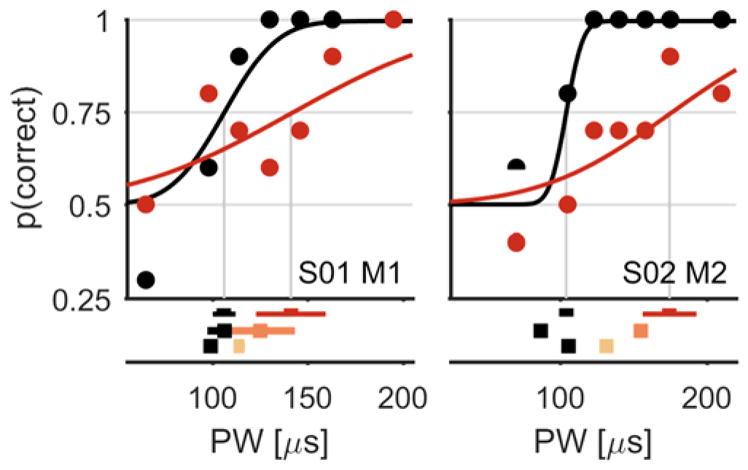
Figure 2.

Detection thresholds: top, two typical psychometric functions showing the subject’s detection performance as a function of PW (for two different subjects and contacts, indicated at the bottom right of each plot). Black traces indicate unadapted threshold measurements and colored traces indicate adapted threshold measurements. Red traces show the shifted psychometric function for the highest conditioning stimulus intensity. Bottom, the subjects’ detection thresholds for three different conditioning intensities (light to dark for low to high conditioning stimulus intensities, respectively). Error bars show 95% confidence intervals.
