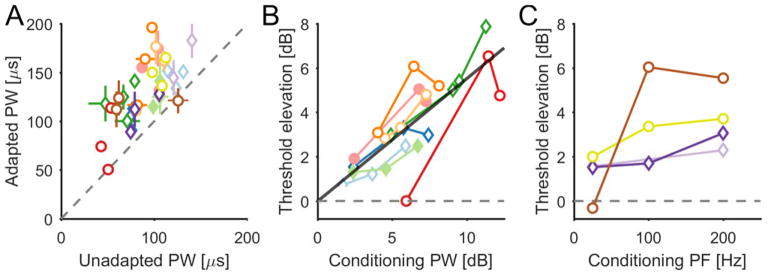
Figure 3.
Conditioning stimuli caused an increase in subjects’ detection thresholds. A| Adapted detection threshold as a function of unadapted threshold. Horizontal and vertical bars indicate 95% confidence intervals. B| Detection threshold elevation as a function of conditioning PW above unadapted threshold (in dB). C| Detection threshold elevation as a function of conditioning PF (in Hz). Colors indicate different contacts and correspond across A, B and C; symbols indicate different subjects (circle for S01 and diamond for S02) and filled symbols correspond to examples shown in figure 1.

