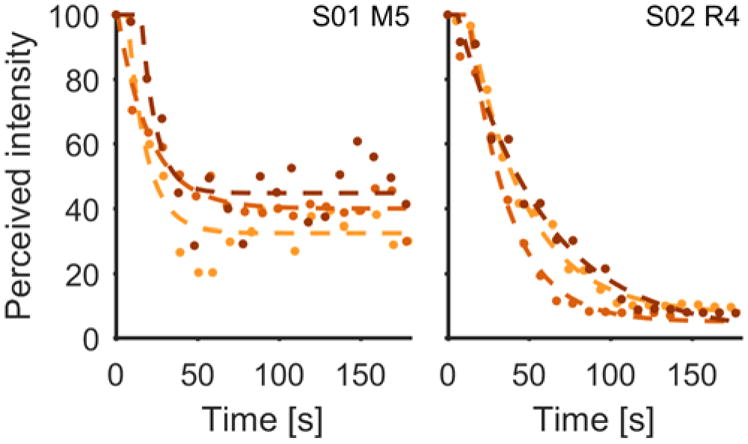
Figure 4.

Intensity tracking: two typical experimental data sets for two different subjects (S01 and S02, indicated in upper right of each plot). Perceived intensity with respect to initial perceived intensity as a function of time for three successive trials. Colors indicate the sequence of trials (bright first, dark last). Dots are raw data, dashed lines show exponential fits.
