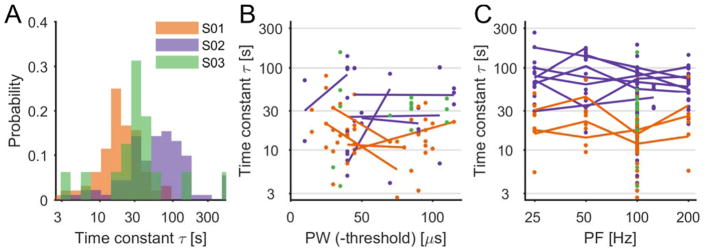
Figure 5.
Intensity decay time constants. A| Histogram for the time constant parameter for the three subjects, all trials pooled. B| Time constants plotted as a function of stimulus PW (above threshold). For these trials, PF=100Hz. C| Time constants plotted as a function of stimulus PF. For B (and C), each dot is a single trial and lines are added when multiple PW (in B) or PF (in C) were tested on the same contact and in the same session (with all other parameters constant). The lines show the average across repetitions for a given PW (or PF). In all three subpanels, colors correspond to different subjects and the time constants are shown on a logarithmic scale.

