
Figure 4.
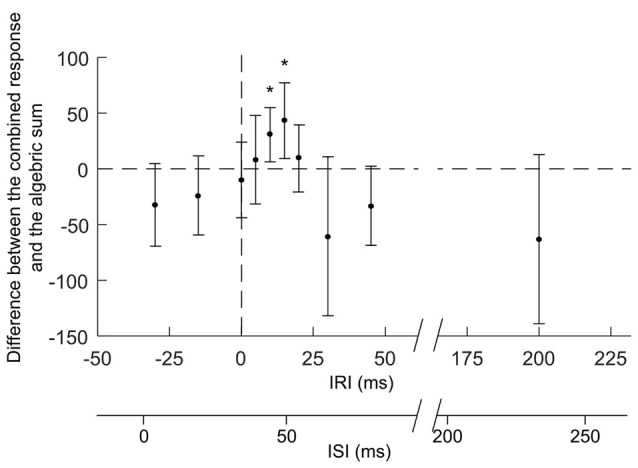
Responses elicited by the combination of iTN and TMS with different inter-response intervals (IRI). The figure reports mean values (and SD) of the magnitude of the combined responses from which the algebraic sum of the SLCR and MEP elicited separately for the respective IRI have been subtracted. The horizontal dashed line indicates no differences between the combined response and the algebraic sum of the two responses elicited separately. MEPs were elicited by TMS delivered at different timings (IRIs: −30, −15, 0, +5, +10, +15, +30, +45 and +200 ms) relative to the onset (time 0) of the SLC of the cGL SLCR. The second x-axis represents the interstimulus intervals (ISIs) between the iTN and the TMS stimulus (ISIs: 4 ± 2, 19 ± 2, 34 ± 2, 39 ± 2, 44 ± 2, 49 ± 2, 54 ± 2, 64 ± 2, 79 ± 2, 95 ± 2 and 234 ± 2 ms). The asterisks indicate significant difference between conditions.