
Figure 5.
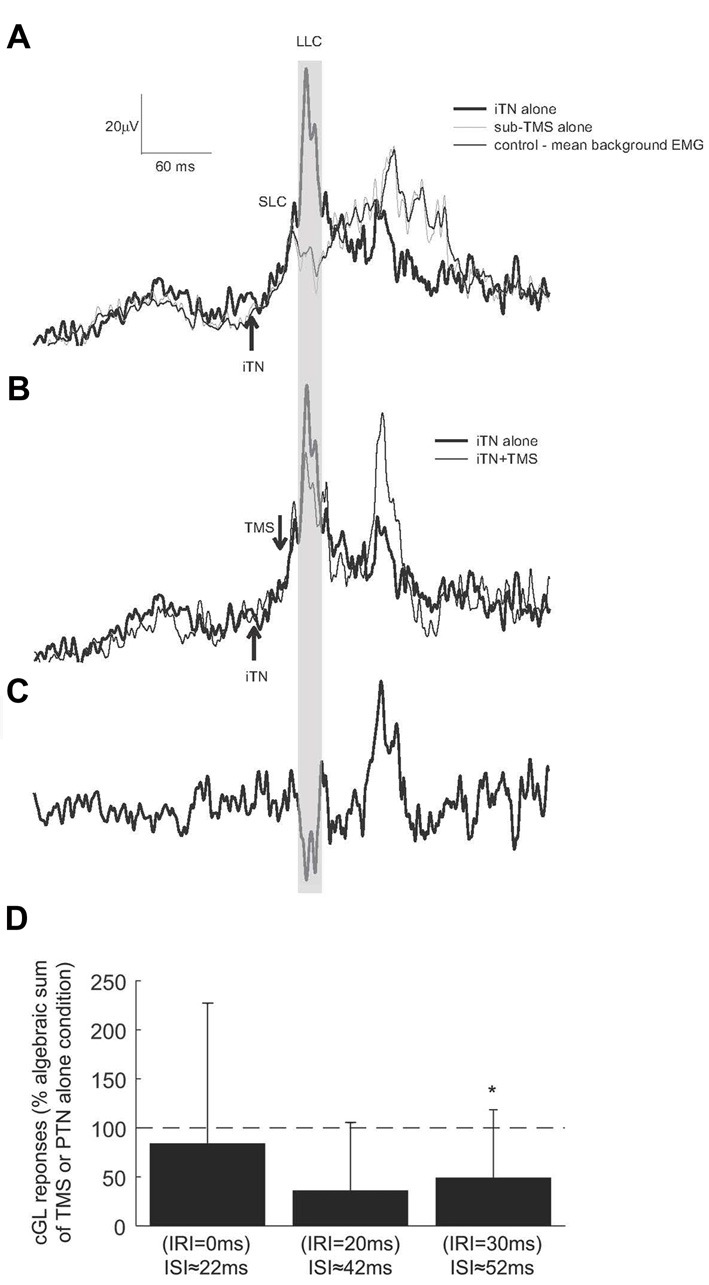
Responses elicited by iTN stimulation and subTMS. (A) The averaged rectified EMG of the cGL for the control (thin trace), isolated iTN stimulation (thick trace) and isolated TMS alone (gray trace) conditions is shown for one representative participant. (B) The cGL EMG is shown for the isolated iTN stimulation condition (thick trace) and the iTN+TMS at an IRI of 20 ms (ISI: 59 ± 2 ms; thin trace) condition. (C) The iTN+TMS at an IRI of 20 ms is subtracted from the isolated iTN condition (the two traced in B). The time window in which the depression occurs is evidenced by the gray shaded area. (D) The magnitudes of responses elicited when iTN and subthreshold TMS were applied to evoke IRIs of 0, 20 and 30 ms (ISIs: 29 ± 2, 49 ± 2 and 59 ± 2 ms) are here shown for all participants. Results are expressed as the algebraic sum of the responses elicited with TMS alone and iTN stimulation alone. The dashed horizontal line indicates 100% (no difference). The asterisks indicate significant differences (p < 0.05).