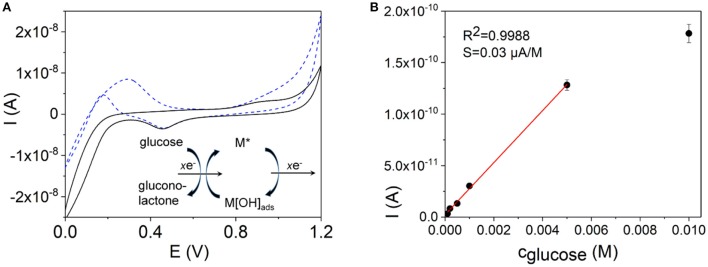
Figure 5.
(A) Cyclic voltammograms of an Au NW electrode in a 0.1 M PBS, pH 7.2, (black line) and in a 1 × 10⁻² M solution of glucose in PBS (blue dashed line). Insert in (A) shows a scheme of the oxidation and reduction processes at the metal electrode surface during oxidation of glucose. (B) A calibration curve as a current dependence on the concentration of glucose. The calibration curve was obtained by means of amperometry at Edet = +0.35 V (vs. Ag/AgCl) using an Au NW electrode prepared by DENA as a working electrode.

