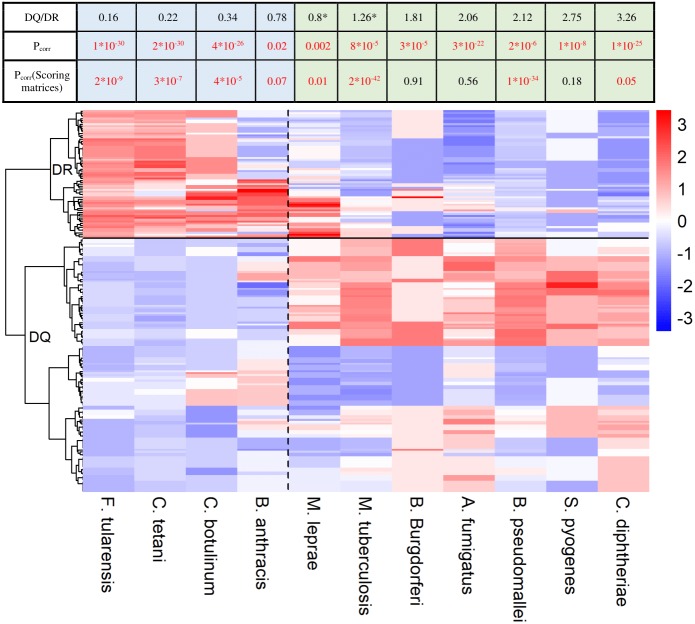
Figure 2. HLA-DQ and DR molecules bind epitopes of different microbes.
The heatmap shows epitope binding by different DQA1-DQB1 allele pairs and DRB1 alleles color coded. In case of each species, colors represent the portion of epitopes recognized by each allele or allele pair. Each row corresponds to a DRB1 allele or DQ allele pair. Rows are clustered using hierarchical clustering (see Methods). DRB1 and DQ molecules are clearly separated based on their species preference (marked with a horizontal line). Epitopes of species on the left are preferred by DR (marked with blue color in the table) and on the right are preferred by DQ molecules (marked with green color in the table). Values were centered and scaled before being clustered and visualized. The ratio between the mean proportion of epitopes bound by DQ allele pairs and DR alleles (DQ/DR) is shown in the table for each species. Note that although computational prediction indicated similar recognition of M. tuberculosis (*) and M. leprae (*) by DQ and DR, analysis of in vitro data showed significantly higher binding scores of these species for DQ (Table S2). Consequently, they were classified into the DQ-associated group. Pcorr represents FDR-corrected P values of Wilcoxon rank sum test. Pcorr values lower than 0.1 were considered to be significant and highlighted with red color.

